Fig. 4.
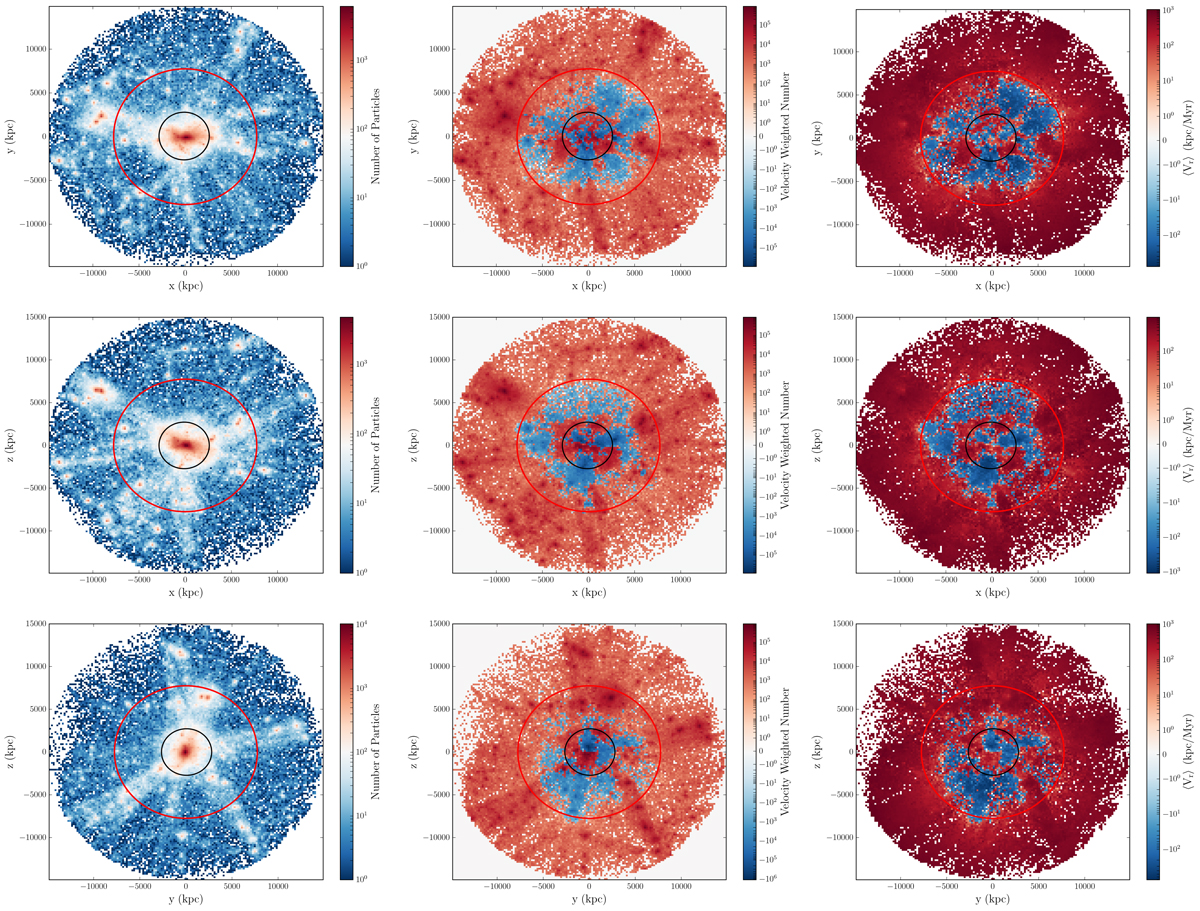
Two-dimensional projections of the M200 = 6.63 × 10¹⁴ M⊙ structure from TNG-300-3 depicted in the right-hand panels of Figs. 1 and 2. Left column: number of particles (representing column density). Middle column: sum of particle radial velocities (representing radial-velocity-weighted column density). Right column: average radial velocity (representing projections of the radial velocity field). Black circles indicate the location of R200 and red circles the location of Rta. Middle and right columns: red hues correspond to outflow and blue hues to infall.
Current usage metrics show cumulative count of Article Views (full-text article views including HTML views, PDF and ePub downloads, according to the available data) and Abstracts Views on Vision4Press platform.
Data correspond to usage on the plateform after 2015. The current usage metrics is available 48-96 hours after online publication and is updated daily on week days.
Initial download of the metrics may take a while.