Free Access
Fig. 2.
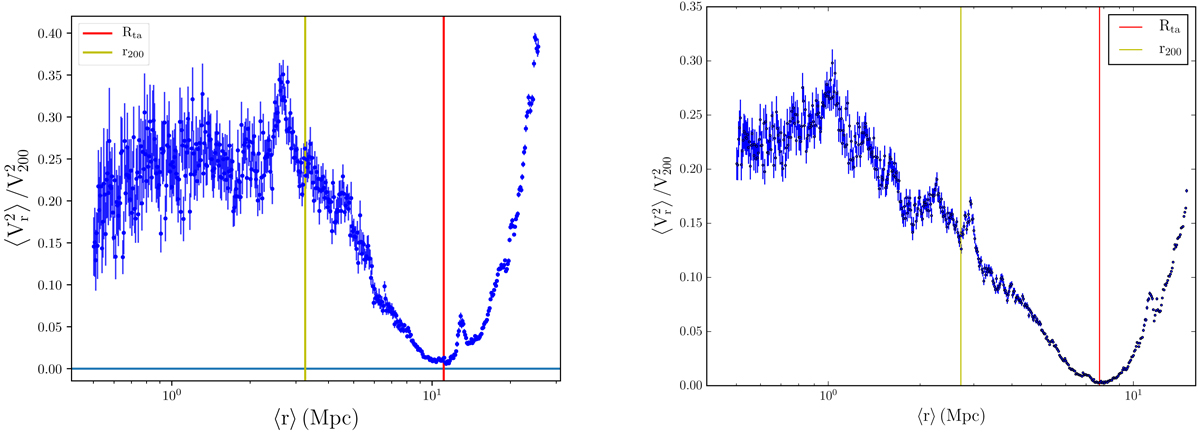
Spherically averaged profiles of the square of radial velocity, for the same objects as the corresponding panels of Fig. 1. Error bars indicate the ![]() uncertainty (standard error of the mean) in each shell. In both panels, the red vertical line indicates the turnaround radius derived from the ⟨Vr⟩ profiles of Fig. 1.
uncertainty (standard error of the mean) in each shell. In both panels, the red vertical line indicates the turnaround radius derived from the ⟨Vr⟩ profiles of Fig. 1.
Current usage metrics show cumulative count of Article Views (full-text article views including HTML views, PDF and ePub downloads, according to the available data) and Abstracts Views on Vision4Press platform.
Data correspond to usage on the plateform after 2015. The current usage metrics is available 48-96 hours after online publication and is updated daily on week days.
Initial download of the metrics may take a while.