Fig. 8.
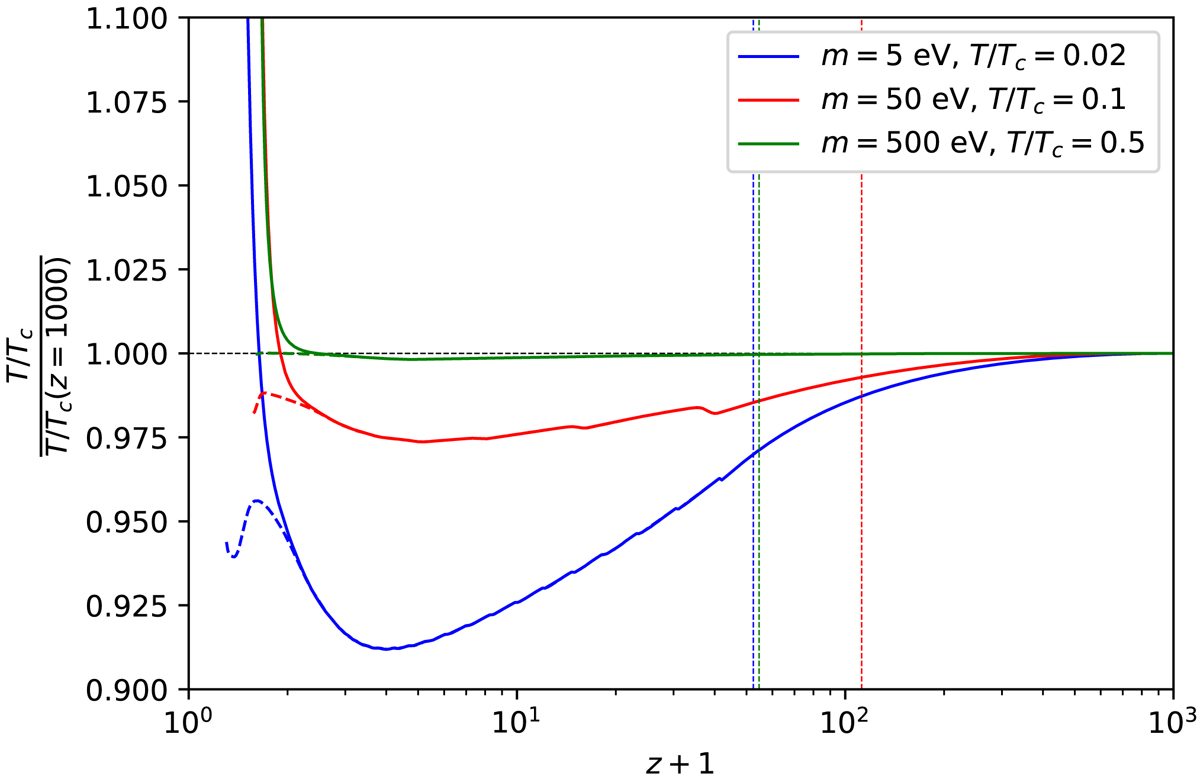
Evolution of T/Tc in the halo center during collapse for various masses and initial temperatures with g = 10−5 eV−2 and L = 100 kpc. Both the evolution with entropy production (solid lines) and without (striped lines) are shown until the overdensity reach 105. The two cases differ only in the end stage of the collapse, well after the critical velocity is first reached, indicated by the colored vertical lines.
Current usage metrics show cumulative count of Article Views (full-text article views including HTML views, PDF and ePub downloads, according to the available data) and Abstracts Views on Vision4Press platform.
Data correspond to usage on the plateform after 2015. The current usage metrics is available 48-96 hours after online publication and is updated daily on week days.
Initial download of the metrics may take a while.