Fig. 4.
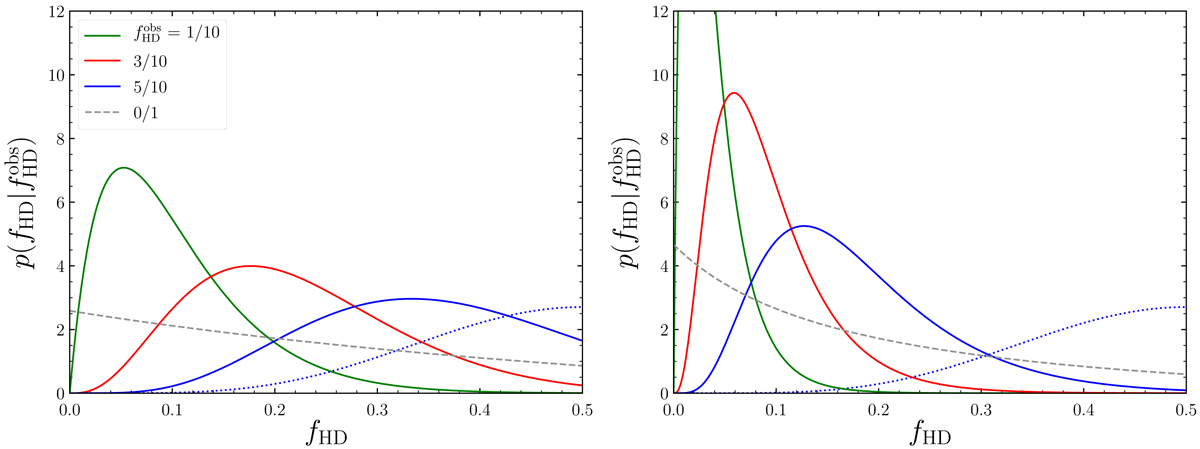
Posterior probability density function of fHD obtained after having observed fraction ![]() of high-density mergers among ten events, for varying
of high-density mergers among ten events, for varying ![]() . The dashed line shows the current constraint, obtained after the single low-density event GRB170817A. The dotted blue line shows the constraint obtained with
. The dashed line shows the current constraint, obtained after the single low-density event GRB170817A. The dotted blue line shows the constraint obtained with ![]() , but ignoring the selection effect, i.e., with r(n1) = r(n2) = 1. Left: assuming the population’s jet kinetic energy distribution follows the short GRB luminosity function of G16. Right: same, for that of WP15.
, but ignoring the selection effect, i.e., with r(n1) = r(n2) = 1. Left: assuming the population’s jet kinetic energy distribution follows the short GRB luminosity function of G16. Right: same, for that of WP15.
Current usage metrics show cumulative count of Article Views (full-text article views including HTML views, PDF and ePub downloads, according to the available data) and Abstracts Views on Vision4Press platform.
Data correspond to usage on the plateform after 2015. The current usage metrics is available 48-96 hours after online publication and is updated daily on week days.
Initial download of the metrics may take a while.