Fig. 9.
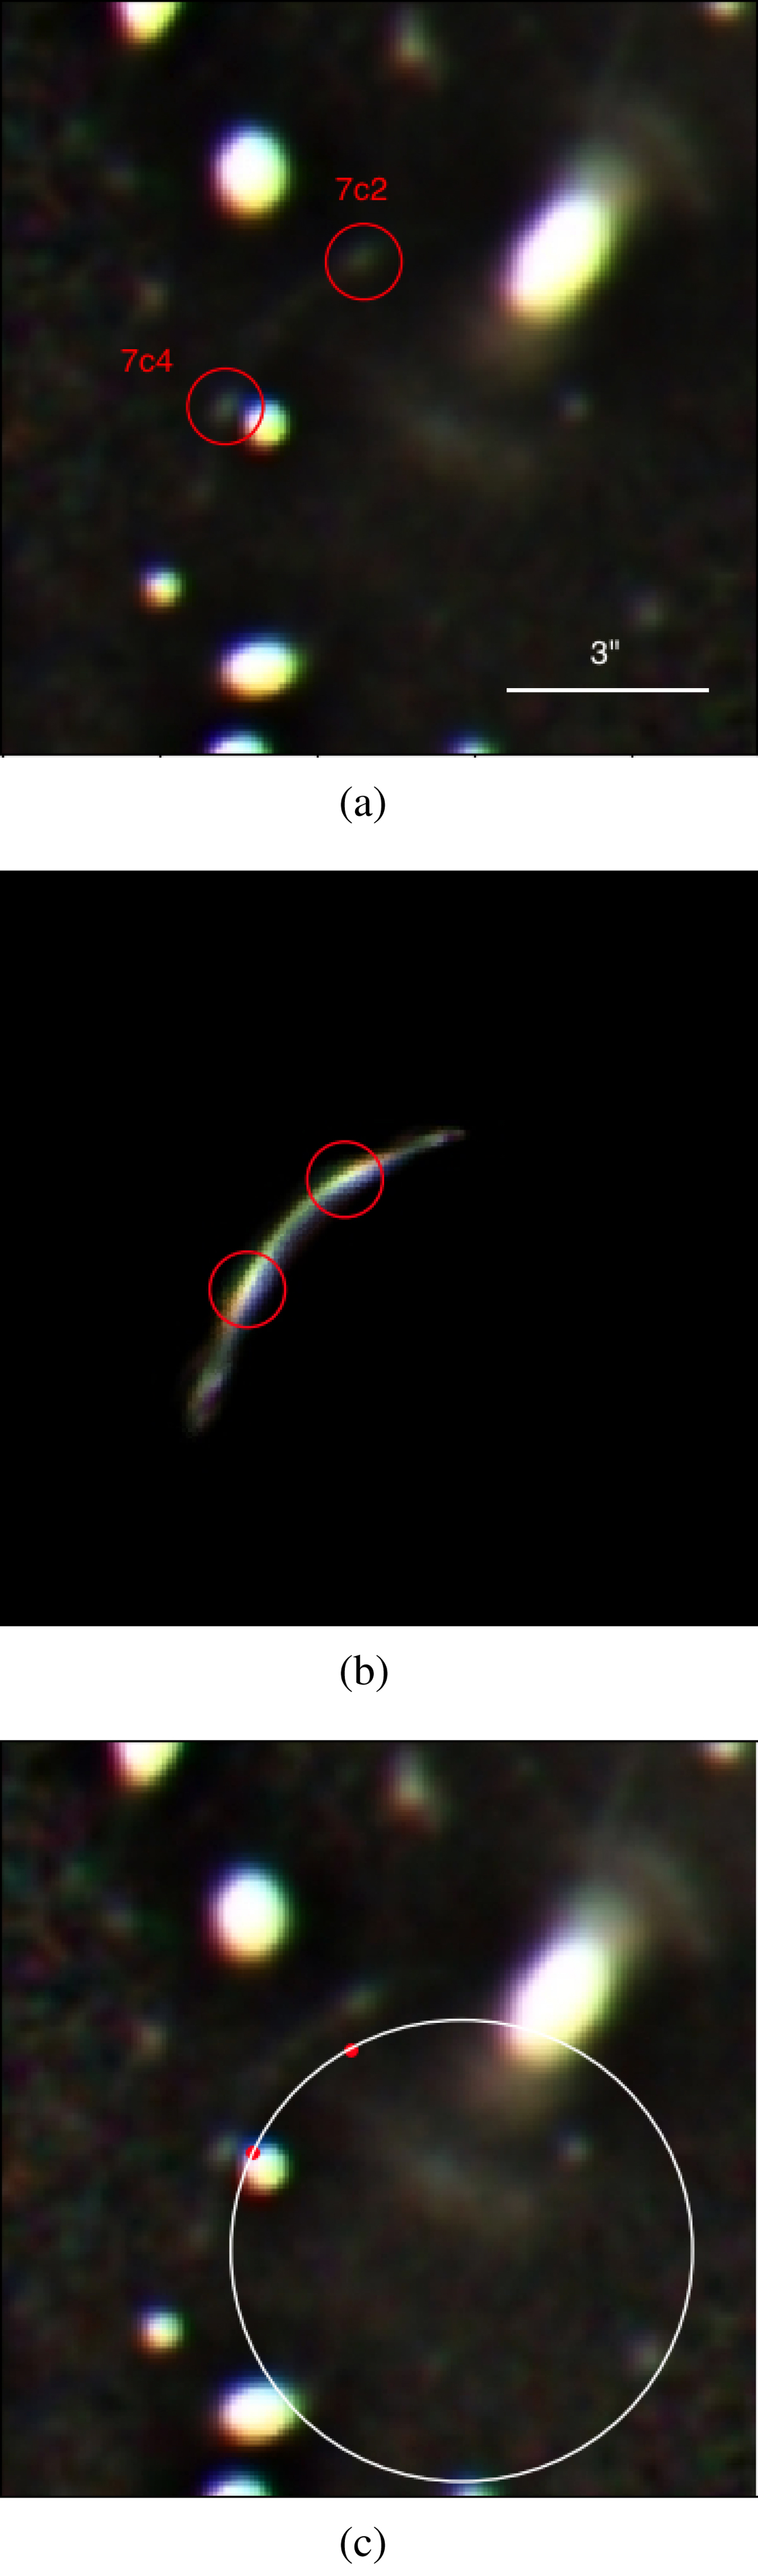
Images of the analysis performed with counter-image 7c. (a) Original counter-image 7c with its two knots, 7c2 and 7c4, indicated with red circles. (b) Counter-image 7c predicted with case 2b with its two knots highlighted. (c) Original counter-image 7c (Fig. 9a) combined with the fit to a circle of the two knots (red dots) from the above prediction (Fig. 9b) so as the shift between both pairs of knots (original and predicted) can be better appreciated.
Current usage metrics show cumulative count of Article Views (full-text article views including HTML views, PDF and ePub downloads, according to the available data) and Abstracts Views on Vision4Press platform.
Data correspond to usage on the plateform after 2015. The current usage metrics is available 48-96 hours after online publication and is updated daily on week days.
Initial download of the metrics may take a while.