Fig. 8.
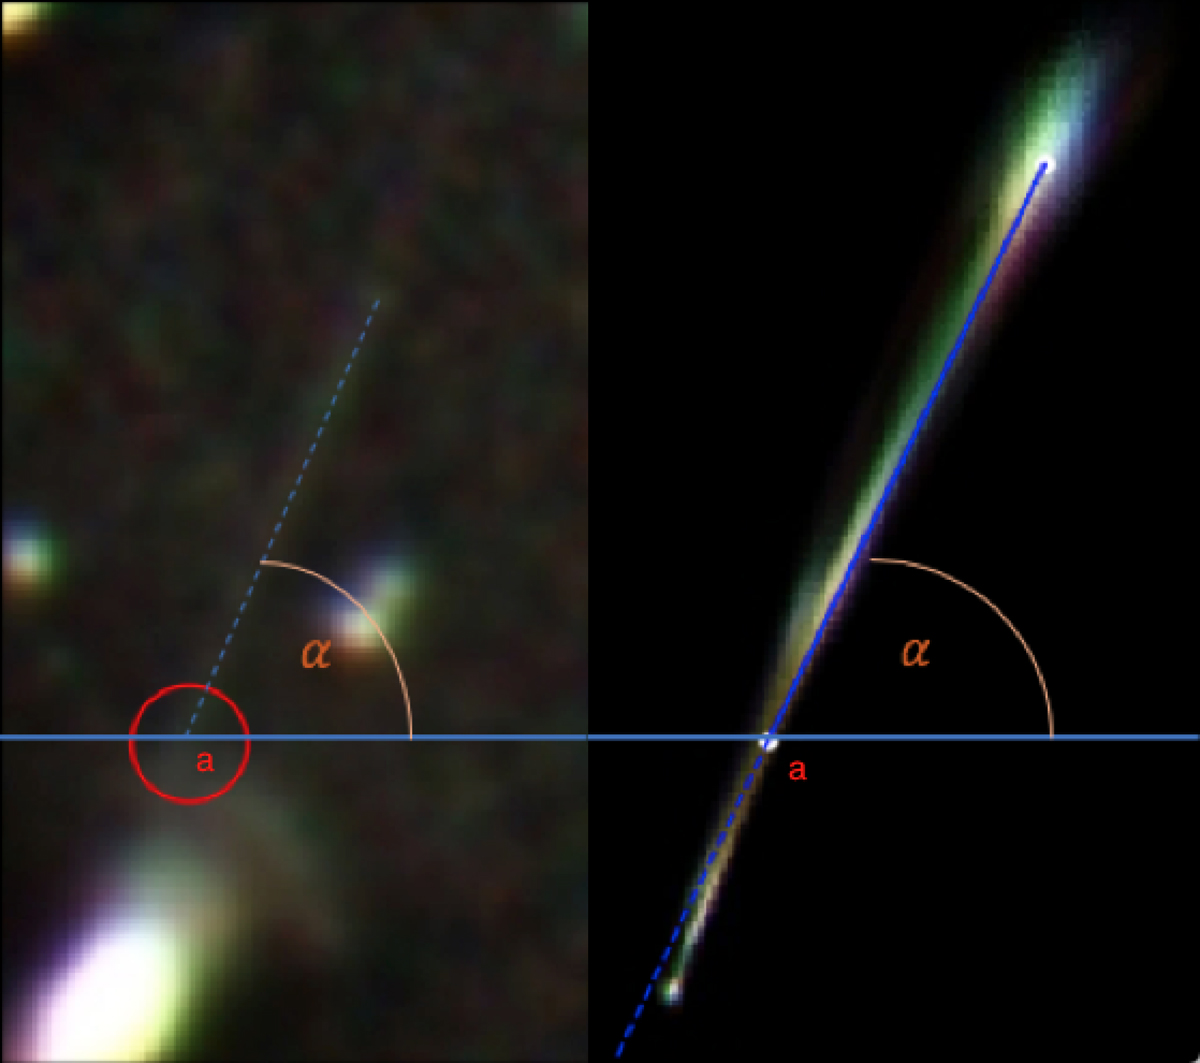
Left: original counter-image 4b where a blue dashed line has been used to approximate its shape, the position where this arc intersects the BCG is surrounded by a red circle (a), and the angle (α) between arc 4b and the x-axis is shown. Right: counter-image 4b predicted with case 2b where position (a) is fixed to the same y-coordinate selected in the left panel and x-coordinate is chosen to correspond with a maximum of the rebuilt image. This counter-image is fitted to a straight line, which has a certain angle (α) with respect to the x-axis. This process is repeated for every model considered.
Current usage metrics show cumulative count of Article Views (full-text article views including HTML views, PDF and ePub downloads, according to the available data) and Abstracts Views on Vision4Press platform.
Data correspond to usage on the plateform after 2015. The current usage metrics is available 48-96 hours after online publication and is updated daily on week days.
Initial download of the metrics may take a while.