Free Access
Fig. 3.
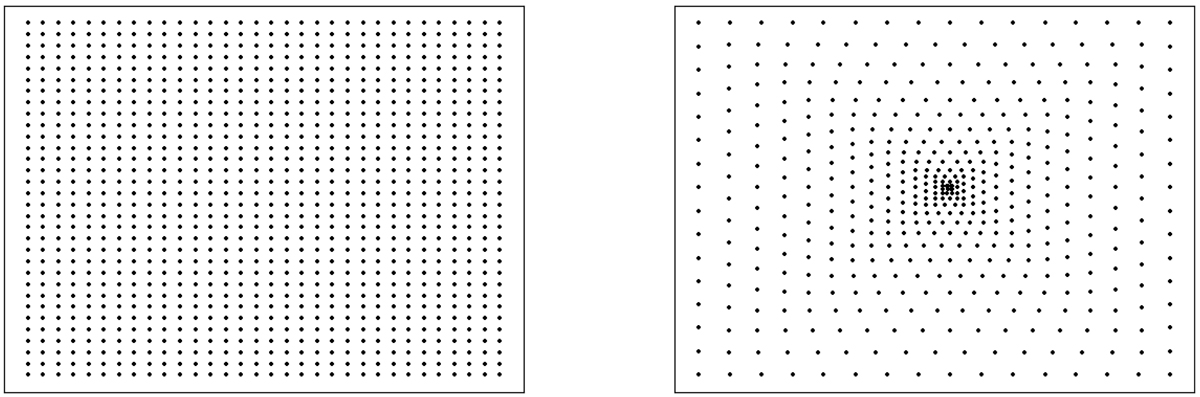
Depiction of the grids used in this work: a regular grid of 1024 cells (left) and a multiresolution grid of 480 cells (right). The peaks of the individual Gaussians are located at the possitions of the dots.
Current usage metrics show cumulative count of Article Views (full-text article views including HTML views, PDF and ePub downloads, according to the available data) and Abstracts Views on Vision4Press platform.
Data correspond to usage on the plateform after 2015. The current usage metrics is available 48-96 hours after online publication and is updated daily on week days.
Initial download of the metrics may take a while.