Fig. 7.
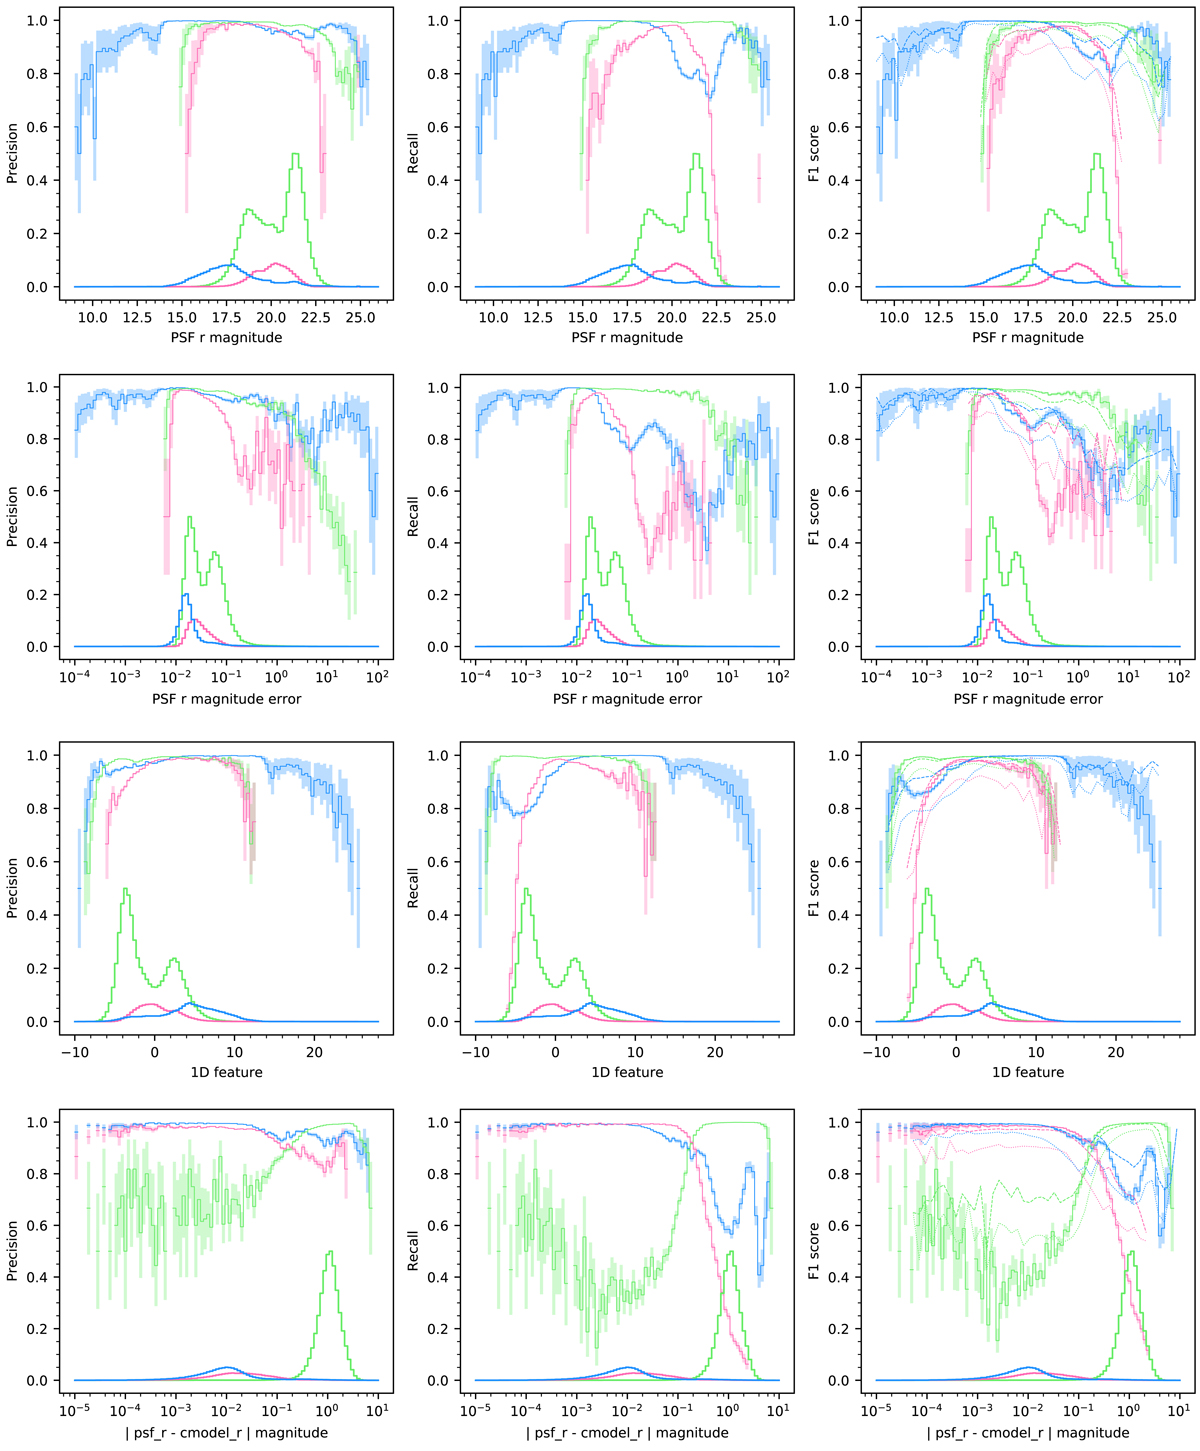
Precision, recall, and F1 score as a function of: PSF r magnitude (first row), PSF r magnitude error (second row), features transformed into one dimension (third row), and the resolvedr parameter (fourth row). These metrics are calculated from applying the random forest model to the test dataset of 1.55 million spectroscopically labelled sources. The shaded area shows a one standard deviation confidence interval calculated per bin from the Wilson score interval. A histogram per class is shown normalised relative to galaxies which peaks at a half. In the last column the dashed lines shows the mean classification probability per bin for the predicted classes, and the dotted lines shows one standard deviation below this mean. Galaxies are in green, quasars in pink and stars in blue.
Current usage metrics show cumulative count of Article Views (full-text article views including HTML views, PDF and ePub downloads, according to the available data) and Abstracts Views on Vision4Press platform.
Data correspond to usage on the plateform after 2015. The current usage metrics is available 48-96 hours after online publication and is updated daily on week days.
Initial download of the metrics may take a while.