Fig. 22.
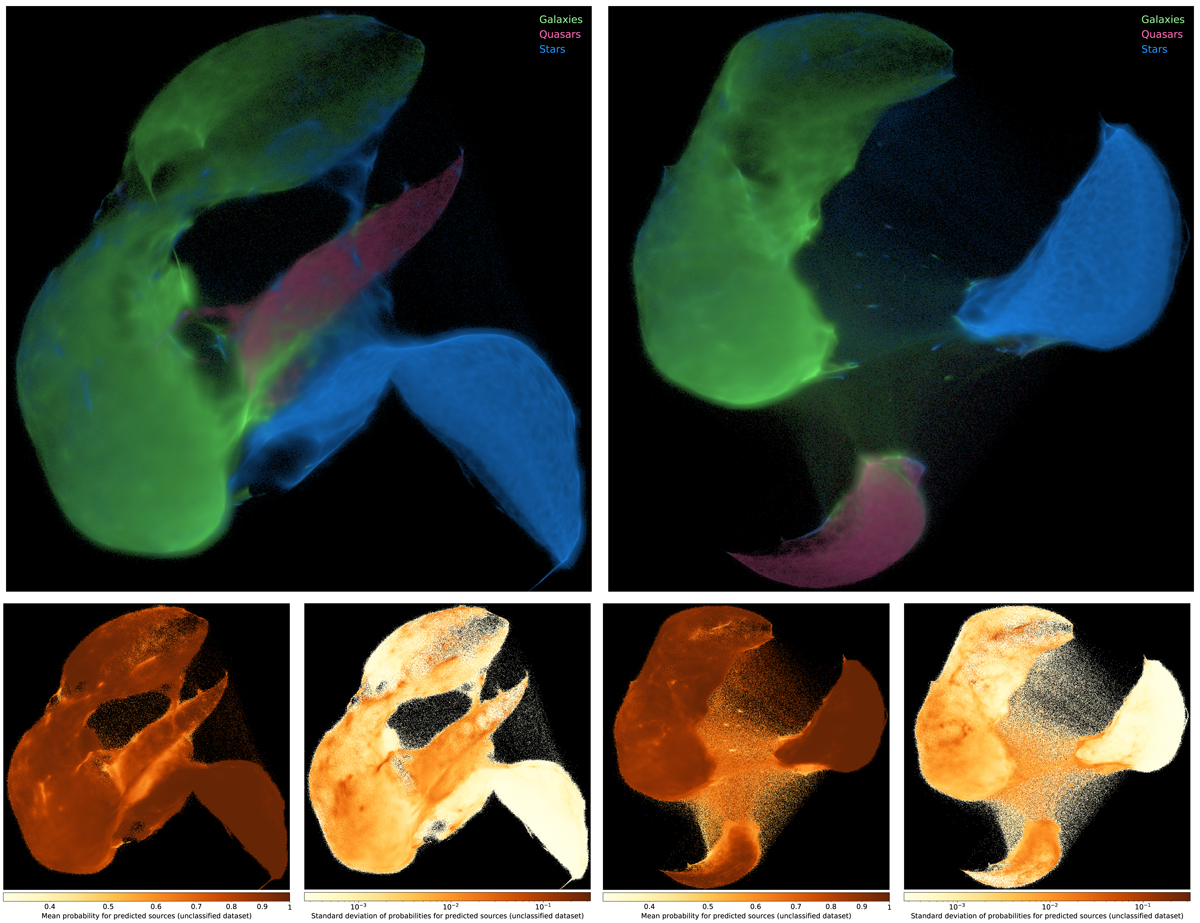
UMAP applied to all 111 million photometrically observed sources in a metric-learning scheme, reducing the number of dimensions (features) from ten to two. UMAP models were obtained in unsupervised (top left) and supervised (top right) schemes using the spectroscopic training dataset (as in Fig. 13), and then all 111 million photometrically observed sources were embedded into this 2-D space. Colours were added afterwards for galaxies (green), quasars (pink), and stars (blue), derived from the random forest model trained on the same spectroscopically observed sources. Source are binned per pixel, and colours are combined proportional to how many of each class are in that pixel bin. The brightness corresponds to the total source count in that pixel on a logarithmic scale. UMAP effectively separates the classes in the same way as with the spectroscopic dataset (Fig. 13) and is in a strong agreement with the random forest. The bottom row shows the mean and standard deviation of the random forest classification probabilities.
Current usage metrics show cumulative count of Article Views (full-text article views including HTML views, PDF and ePub downloads, according to the available data) and Abstracts Views on Vision4Press platform.
Data correspond to usage on the plateform after 2015. The current usage metrics is available 48-96 hours after online publication and is updated daily on week days.
Initial download of the metrics may take a while.