Fig. 21.
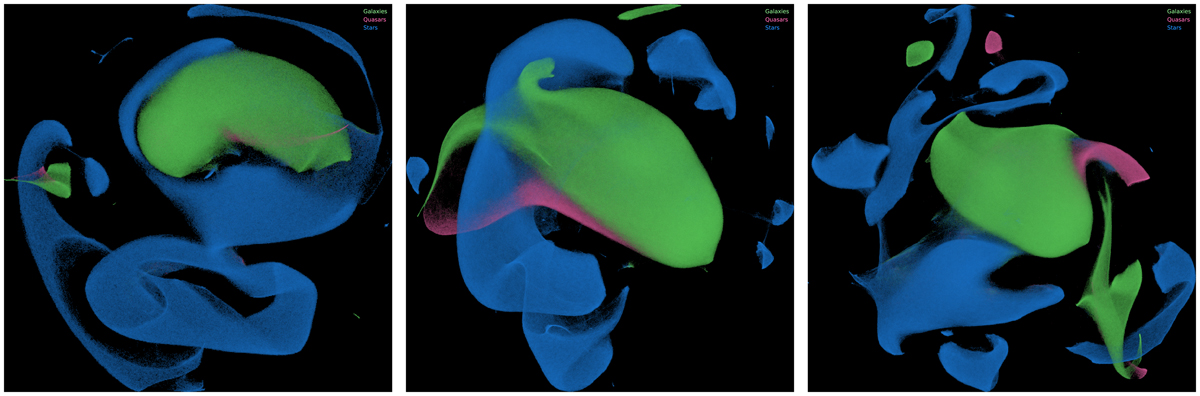
UMAP applied to various subsets of data, reducing the original ten features to the two which are plotted. Sources are binned per pixel, with colours combined proportional to how many of each class are in that pixel bin. The brightness corresponds to the total source count in that pixel on a logarithmic scale. Source labels for galaxies (green), quasars (pink), and stars (blue) were derived from our random forest model. Left: 11 million photometrically observed sources without spectra run in an unsupervised scheme. Middle: all spectroscopically observed sources in our dataset, plus 11 million photometrically observed sources, run in an unsupervised scheme. Right: same as the middle plot but with the class labels of spectroscopically observed sources passed to the UMAP algorithm in a semi-supervised scheme. Including the spectroscopically observed sources in unsupervised (middle plot), and semi-supervised schemes (right plot) UMAP helps UMAP separate out the classes without them overlapping (particularly the minority class of quasars). Furthermore, our labels assigned from the random forest model show that even when classes overlap in this 2-D space, the structures picked out by UMAP are consistent with our class labels.
Current usage metrics show cumulative count of Article Views (full-text article views including HTML views, PDF and ePub downloads, according to the available data) and Abstracts Views on Vision4Press platform.
Data correspond to usage on the plateform after 2015. The current usage metrics is available 48-96 hours after online publication and is updated daily on week days.
Initial download of the metrics may take a while.