Fig. 14.
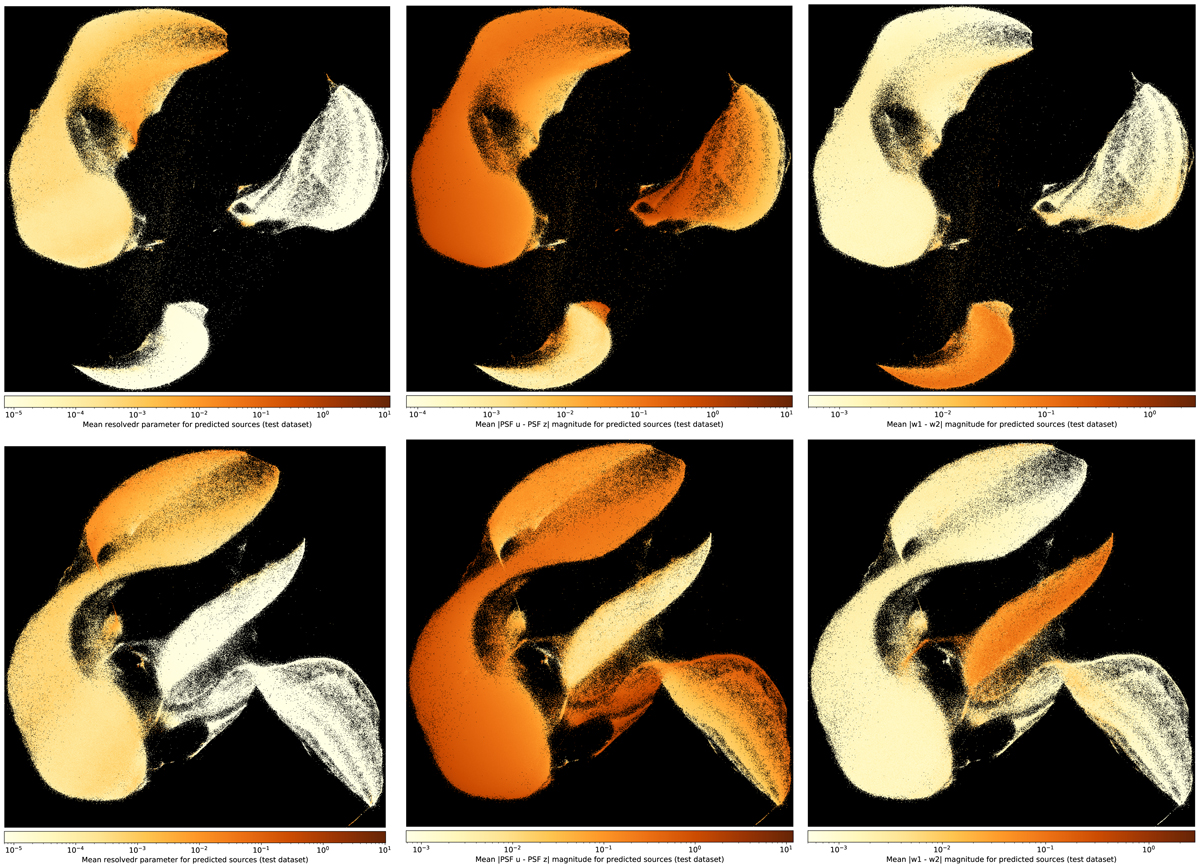
Test dataset of 1.55 million spectroscopically observed sources processed with UMAP to reduce from ten features to two in supervised (top row) and unsupervised (bottom row) schemes. The resulting two dimensions are plotted, with sources binned per pixel and coloured by the resolvedr parameter (left column), an SDSS colour |PSF u − PSF z| (middle column) and a WISE colour |w1 − w2| (right column). Whilst the axis have no physical meaning in this two dimensional space, UMAP returns proportionate distances between points and clusters, effectively displaying local and global structures in both supervised and unsupervised schemes. Galaxies can be seen distributed by how resolved they are, separating nearby extended galaxies from distant point sources. Furthermore, red galaxies can be distinguished from blue ones and green valley galaxies can be seen connecting the two regions. Stars are arranged in an alternate representation of a Hertzsprung Russell diagram, distinguishing their colour and luminosity. Quasars are predominantly unresolved bluer sources, though redder quasars are seen on the outskirts of the cluster.
Current usage metrics show cumulative count of Article Views (full-text article views including HTML views, PDF and ePub downloads, according to the available data) and Abstracts Views on Vision4Press platform.
Data correspond to usage on the plateform after 2015. The current usage metrics is available 48-96 hours after online publication and is updated daily on week days.
Initial download of the metrics may take a while.