Fig. 13.
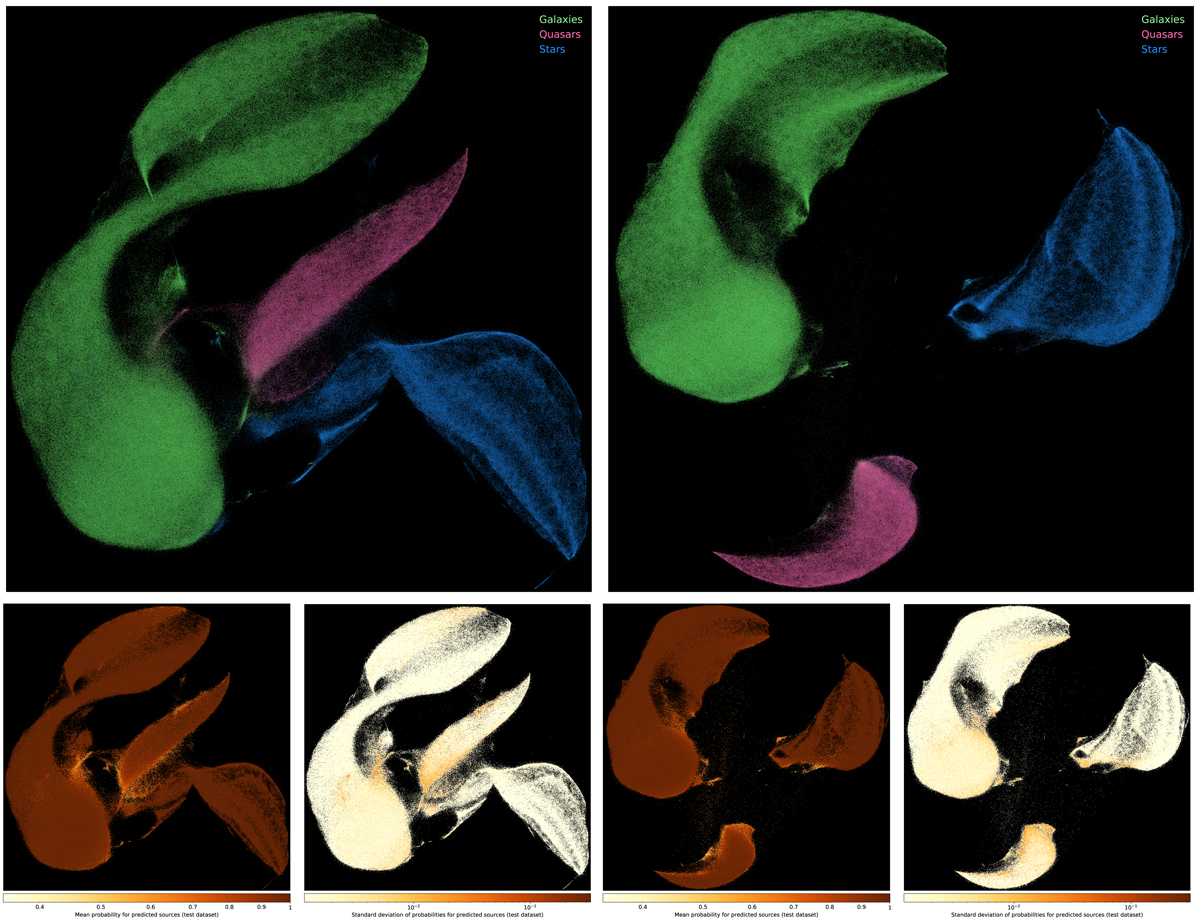
Test dataset of 1.55 million spectroscopically observed sources processed with UMAP in unsupervised (top left) and supervised (top right) schemes to reduce from ten features to two. The resulting two dimensions are plotted, with sources binned per pixel and colours combined proportional to how many of each class are in that pixel bin. Galaxies are shown in green, quasars in pink and stars in blue. The brightness corresponds to the total source count in that pixel on a logarithmic scale. Whilst the axis have no physical meaning in this 2-D space, UMAP returns proportionate distances between points and clusters, effectively displaying local and global structures in both supervised and unsupervised schemes. The bottom row shows the mean and standard deviation of the random forest classification probabilities.
Current usage metrics show cumulative count of Article Views (full-text article views including HTML views, PDF and ePub downloads, according to the available data) and Abstracts Views on Vision4Press platform.
Data correspond to usage on the plateform after 2015. The current usage metrics is available 48-96 hours after online publication and is updated daily on week days.
Initial download of the metrics may take a while.