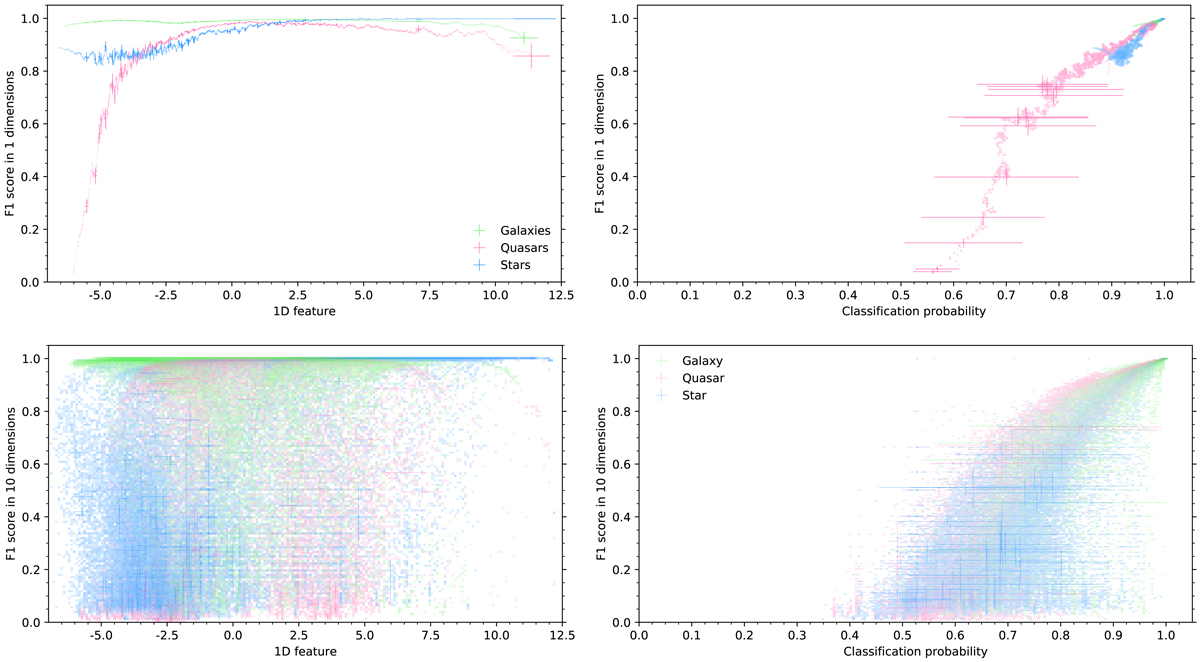
Fig. 12.

100 000 sources from our spectroscopic test dataset, the F1 score is calculated from 10 000 nearest neighbours in 1-D (top) and 10-D (bottom) feature spaces, plotted against the mean 1-D feature (left) and mean classification probability (right) for those neighbours. Sources are binned per pixel and colours combined proportional to how many of each class are in that pixel bin. The brightness corresponds to the total source count in that pixel on a logarithmic scale. A small sample of individual data points with their error bars are also overlaid.
Current usage metrics show cumulative count of Article Views (full-text article views including HTML views, PDF and ePub downloads, according to the available data) and Abstracts Views on Vision4Press platform.
Data correspond to usage on the plateform after 2015. The current usage metrics is available 48-96 hours after online publication and is updated daily on week days.
Initial download of the metrics may take a while.


