Fig. 11.
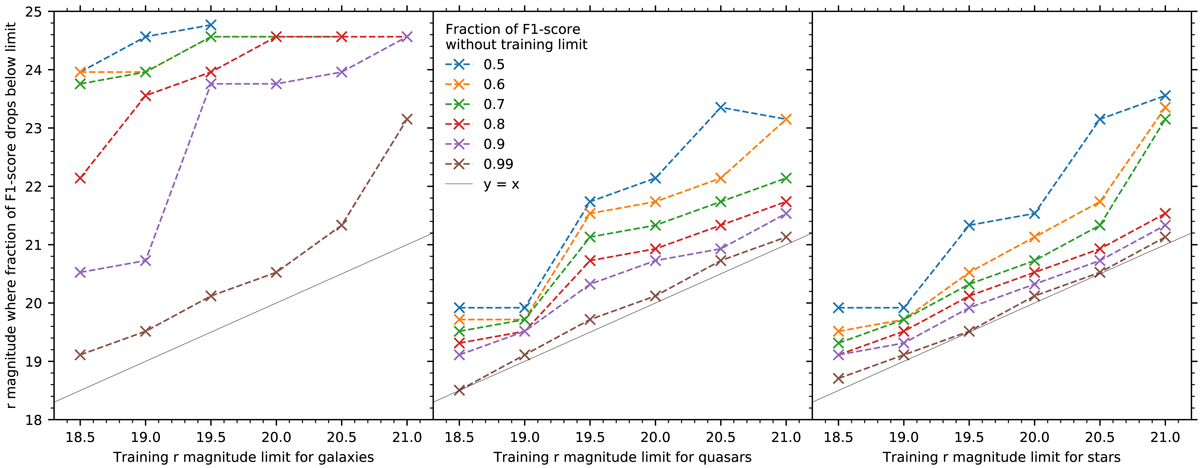
r magnitude training upper limit plotted against r magnitude at which the F1 score drops to a fraction of the F1 score (shown in the legend) without a r magnitude training limit. Below this limit 50% of the data were used for training. A linear relationship is maintained for stars and quasars, while galaxies show a non-linear change between r magnitude of 19 and 20 for F1 score fractions less than 0.9 (also seen in Fig. 10).
Current usage metrics show cumulative count of Article Views (full-text article views including HTML views, PDF and ePub downloads, according to the available data) and Abstracts Views on Vision4Press platform.
Data correspond to usage on the plateform after 2015. The current usage metrics is available 48-96 hours after online publication and is updated daily on week days.
Initial download of the metrics may take a while.