Fig. 5.
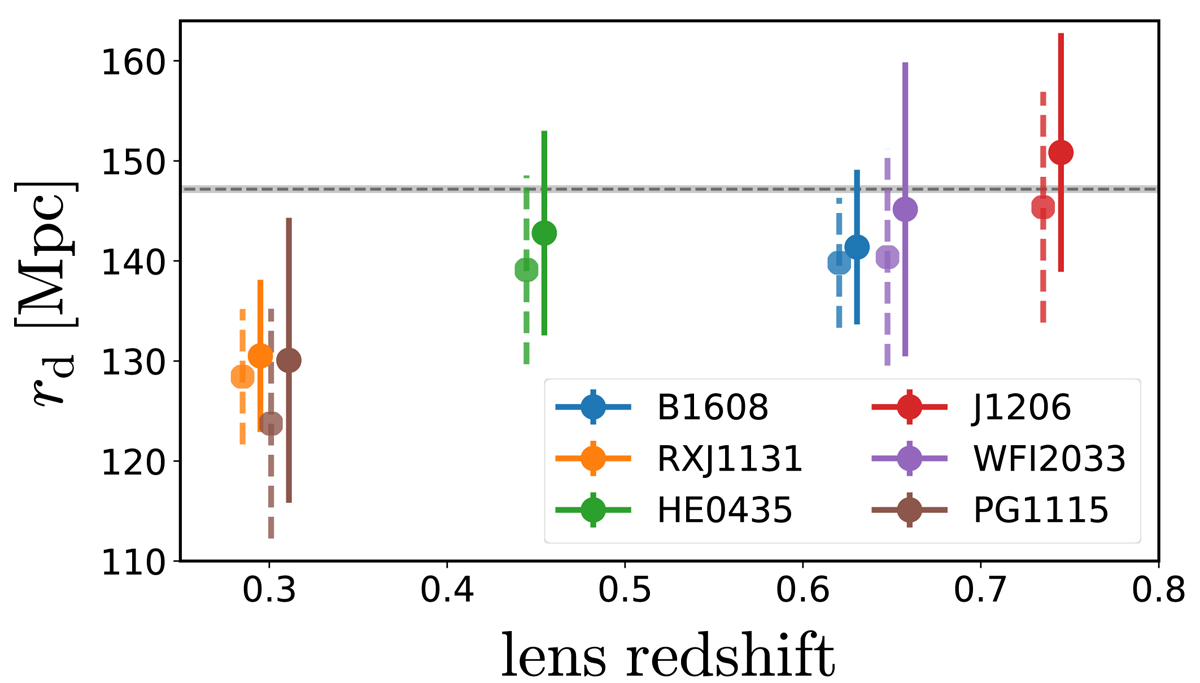
Sound horizon rd measured from combining BAO and SNe data with H0LiCOW lensing observations of each lens separately. Here, the distance calibration is set solely by the lensing observations of each individual lens. The measured sound horizon is shown as a function of lens redshift for fits with a flat model 3 (solid error bars) and a flat PEDE-CDM model (dashed error bars). For both models, the measurements show a slight trend of rd increasing with lens redshift. The inference from models 1 and 2 is fully consistent with the model 3 results. The grey dashed line with shaded region shows Planck’s value of rd and its (sub-percent) uncertainty obtained for the standard flat ΛCDM model.
Current usage metrics show cumulative count of Article Views (full-text article views including HTML views, PDF and ePub downloads, according to the available data) and Abstracts Views on Vision4Press platform.
Data correspond to usage on the plateform after 2015. The current usage metrics is available 48-96 hours after online publication and is updated daily on week days.
Initial download of the metrics may take a while.