Open Access
Fig. 2.
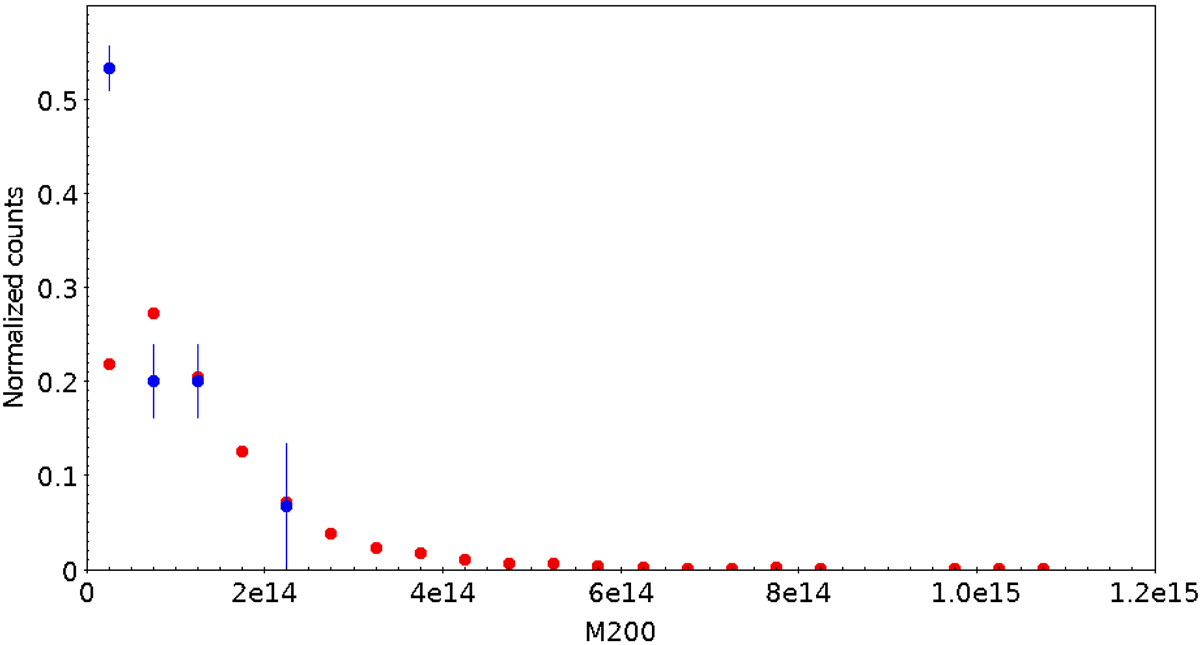
Arbitrarily normalized counts of the estimated M200 masses (in M⊙ units) of the AMASCFI candidate structures. Red dots represent the whole sample, and blue dots show structures with a probability higher than 50% to be a FG. Both samples are normalized. Error bars are Poissonian.
Current usage metrics show cumulative count of Article Views (full-text article views including HTML views, PDF and ePub downloads, according to the available data) and Abstracts Views on Vision4Press platform.
Data correspond to usage on the plateform after 2015. The current usage metrics is available 48-96 hours after online publication and is updated daily on week days.
Initial download of the metrics may take a while.