| Issue |
A&A
Volume 638, June 2020
|
|
|---|---|---|
| Article Number | L12 | |
| Number of page(s) | 4 | |
| Section | Letters to the Editor | |
| DOI | https://doi.org/10.1051/0004-6361/202038494 | |
| Published online | 25 June 2020 | |
Letter to the Editor
Discovery of rotation axis alignments in Milky Way globular clusters
1
Instituto Interdisciplinario de Ciencias Básicas (ICB), CONICET-UNCUYO, Padre J. Contreras 1300, M5502JMA Mendoza, Argentina
e-mail: andres.piatti@unc.edu.ar
2
Consejo Nacional de Investigaciones Científicas y Técnicas (CONICET), Godoy Cruz 2290, C1425FQB Buenos Aires, Argentina
Received:
26
May
2020
Accepted:
11
June
2020
There is an increasing number of recent observational results that show that some globular clusters exhibit internal rotation while they travel along their orbital trajectories around the Milky Way center. Based on these findings, we searched for any relationship between the inclination angles of the globular cluster orbits with respect to the Milky Way plane and those of their rotation. We discovered that the relative inclination, in the sense of inclination of the rotation axis to orbit axis, is a function of the orbit inclination of the globular cluster. Rotation and orbit axes are aligned for an inclination of ∼56°, while the rotation axis inclination is far from the orbit inclination between ∼20° and −20° when the latter increases from 0° up to 90°. We further investigated the origin of this linear relationship and found no correlation with the semimajor axes and eccentricities of the globular cluster orbits, nor with the internal rotation strength, the globular cluster sizes, actual and tidally disrupted masses, or half-mass relaxation times, among others. The uncovered relationship will affect the development of numerical simulations of the internal rotation of globular clusters, our understanding of the interaction of globular clusters with the gravitational field of the Milky Way, and the observational campaigns made to increase the number of globular clusters with detected internal rotation.
Key words: globular clusters: general / methods: observational
© ESO 2020
1. Introduction
Piatti (2019) examined the inclinations (I) of globular cluster orbits around the Milky Way center and found that they are not aligned in the same planar configuration as the so-called vast polar structure (Pawlowski & Kroupa 2014); his findings were recently confirmed by Riley & Strigari (2020). Furthermore, Piatti reported a linear relationship between I and the eccentricity of prograde orbits (globular clusters rotating in the direction of the Milky Way rotation), in the sense that the higher the eccentricity, the higher the inclination, with a variation of ∼10° at most around the mean value at a fixed eccentricity. This correlation was also found to be a function of the semimajor axis (or averaged galactrocentric distance) in such a way that outermost globular clusters have orbits with the highest I values and high eccentricities. Globular clusters with retrograde orbits are scattered throughout the whole I range and have eccentricities higher than ∼0.4.
While orbiting the Milky Way center, globular clusters are also subject to tidal forces, which cause them to lose stars that can amount up to nearly half of their initial masses, depending on the shape of their orbits, peri- and apogalactocentric distances, etc. Because the stars are redistributed within the globular clusters, the internal dynamical evolution is also altered compared to the evolution that would be expected if the globular clusters evolved in isolation. The result is that their internal evolution is accelerated, so that globular clusters are seen at more advanced internal dynamics evolutionary stages (Piatti et al. 2019, and reference therein).
There is evidence that some globular clusters still retain some level of their primordial rotation (Sollima et al. 2019), which has long been assumed to start with a complete alignment (coplanarity) with the axis of the orbital angular velocity vector (Tiongco et al. 2018, and references therein). However, considering the long-term interaction between globular clusters and the Milky Way potential mentioned above, the question is whether the orbit and rotation planes are linked in some way, or whether galactic and rotation motions are independent of each other. The topic has not received much attention in the literature, possibly because we lack a statistically significant sample of observational results on the rotation of globular clusters.
In Sect. 2 we compute the rotation axis inclinations (i) of a sample of globular clusters with respect to the Milky Way plane, in order to compare them with the I values. Section 3 reports the analysis of this comparison and discusses the revealed interplay between I and i. Finally, Sect. 4 summarizes the main conclusions of this work.
2. Estimating the rotation axis inclination
We made use of the rotation parameters derived by Sollima et al. (2019, their Table 2) for the largest studied sample of globular clusters with detected rotation (see also their Table 3). They fit the amplitude (A), the inclination of the rotation axis with respect to the line of sight (LOS) (inc), and the position angle θ0 of the projected rotation axis on the sky. Thus, they provided equations to compute the velocity components in the direction parallel and perpendicular to the projected rotation axis on the sky and along the LOS of any point located at a small distance from the globular cluster center and at a position angle θ. Our strategy consisted of rotating this framework around the LOS axis by an angle θ0 in order to move the components of the rotation velocity along the RA and Dec axes. In doing this, we used the following expressions:
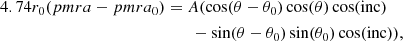


where r0, pmra0, pmdec0, and RV0 are the mean globular cluster heliocentric distance, and RA and Dec proper motions and radial velocity, respectively (Baumgardt et al. 2019). We generated a sample of points for each globular cluster that was distributed uniformly along θ from 0° up to 360° (θ is measured from north to west) in steps of 1″ and at a distance from the globular cluster centers equal to 10−3 times their tidal radii (Baumgardt et al. 2019). We then computed Galactic coordinates (X, Y, Z) and space velocities (VX, VY, VZ) employing the astropy1 package (Astropy Collaboration 2013, 2018), which simply required the input of r0, pmra, pmdec, and RV given by Eqs. (1)–(3).
The components of the rotational angular momentum were calculated according to


and the inclination of the rotation axis was derived as
where the subscript 0 (zero) in Eqs. (4)–(6) refers to the mean orbital position and motion of the globular cluster. We adopted as uncertainties of i the standard deviation from all the generated individual i values. Because I (see Piatti 2019) and i values range from 0° for fully prograde in-plane orbits (or coplanar prograde rotation) to 90° for polar orbits (or a rotation plane perpendicular to the Galactic plane), to 180° for in-plane retrograde orbits or rotation planes, we defined I* = 180 ° −I and i* = 180 ° −i, which proved useful in the subsequent analysis.
3. Analysis and discussion
The orbital properties of the globular clusters are pictured in Fig. 1, where the relationship between the Galactic velocity component Vϕ (spherical coordinates), the eccentricity, and I* derived by Piatti (2019) are shown. Globular clusters with prograde (Vϕ > 0) and retrograde (Vϕ < 0) orbits are clearly distinguished. The latter have relatively high eccentricities and nearly polar trajectories (I* > 80°). These globular clusters have long been thought to have an accreted origin (Forbes & Bridges 2010). They are highlighted in Fig. 1 with black-ringed circles. Globular clusters with prograde orbital motions show a trend between Vϕ and the eccentricity, so that the higher the rotational velocity, the more circular their orbits (lower eccentricities) and the lower the I* values. Those with more circular orbits have tightly copied the rotation of the Milky Way disk.
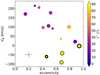 |
Fig. 1. Relationship between orbital parameters of the globular clusters. Typical error bars are included. Black-ringed circles represent globular clusters with retrograde motions. The size of the symbols is proportional to log(a); the smallest and largest symbols correspond to a = 1.6 and 13.6 kpc, respectively. |
We also used the semimajor axes of the globular cluster orbits (a) defined as the average between the peri- and apogalactocentric distances computed by Baumgardt et al. (2019). They better represent the distance of the globular cluster birthplaces to the Milky Way center or the average distance where globular clusters were deposited after accretion of their host dwarf galaxy onto the Milky Way. The globular clusters in our sample span a values from 1.6 up to 13.6 kpc, that is, they populate the Milky Way bulge (Galactocentric distance < 3 kpc, Barros et al. 2016) and disk. They are represented in Fig. 1 with circles whose sizes are proportional to log(a/kpc). Globular clusters with prograde and retrograde orbits cover the entire range of a values. From this point of view, the globular clusters can be considered as representative of the whole globular cluster population in the Galactic volume we considered. If some relationship existed between I* and i*, this should therefore be discovered from them.
We first calculated the mean and dispersion of i* by employing a maximum likelihood approach. The relevance lies in accounting for the individual i* measurement errors, which might artificially inflate the dispersion if ignored. We therefore optimized the probability ℒ that a given ensemble of i* values with errors σ(i*) is drawn from a population with mean rotation axis inclination ⟨i*⟩ and intrinsic dispersion W (e.g., Pryor & Meylan 1993; Walker et al. 2006), as follows:
![$$ \begin{aligned} \mathcal{L} \,=\,\prod _{k=1}^N\, \left(\,2\pi \left[\sigma _k^2 + W^2 \, \right]\,\right)^{-\frac{1}{2}} \times \,\exp \left(-\frac{\left(i^*{_k} \,- < i^*>\right)^2}{\sigma _k^2 + W^2} \right), \end{aligned} $$](/articles/aa/full_html/2020/06/aa38494-20/aa38494-20-eq8.gif)
where the errors on the mean and dispersion were computed from the respective covariance matrices. We would like to note that this approach assumes that the error distribution is Gaussian, which is adopted here because of the limited number of globular clusters (cf. Frank et al. 2015). The resulting mean i* and dispersion are (61.8 ± 4.8)° and (10.5 ± 0.7)°, respectively. This outcome reveals that the rotation axis inclinations are not randomly distributed; they do not span the whole range of values ([0°, 90°]). They are not all aligned to the orbit axes either, but span a moderately small intrinsic range. Because the mean i* value and dispersion come from globular clusters that rotate in the same direction as their orbital motions (prograde or retrograde orbits), or in the opposite direction to their orbital motions, this result might suggest that some condition might have led the rotation axis inclinations to be more or less polarized, regardless of the direction of the orbital motion and that of the rotation. The small globular cluster sample we analyzed could refute this speculation if a larger sample were used instead. However, this would not be the case, as judged by the subsequent results.
Figure 2 depicts the difference between the rotation and orbit axis inclinations as a function of I*. We have distinguished globular clusters with prograde or retrograde orbital motions, and those with prograde or retrograde rotation. One globular cluster (NGC 7078) has a prograde orbit and two globular clusters (NGC 5139, 7089) have retrograde orbits that rotate in the opposite direction to their orbital motions. They are highlighted with black-ringed symbols. The figure uncovers a relationship between i* and I* that to our knowledge has not been theoretically predicted before, nor has it been found in numerical simulations of the evolution of rotating star clusters or been discovered observationally. The relative inclinations follow a linear relationship with I* of

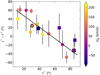 |
Fig. 2. Relative inclination vs. orbital plane inclination for the globular clusters. Circles and squares refer to globular clusters moving around the Milky Way center or rotating in prograde and retrograde directions, respectively. Black-ringed symbols represent globular clusters with opposite direction of orbital and rotational motions. Individual error bars are indicated; those for I* are as large as the symbol sizes. The black line represents the fitted relationship (see text). |
with a standard deviation of ±18.2° when we fit the points by a least-squares method. We obtained a correlation of 0.80 and an F-test coefficient of 0.90, which undoubtedly rejects the possibility that the relative inclinations for the small sample of 15 globular clusters were dominated by a point dispersion.
This finding reveals that if the rotation axis was aligned to the orbit axis at the globular cluster’s birth, this configuration changed in the long-term evolution. Otherwise, if the rotation axis is thought not to change in the globular cluster lifetime, then the traditional scenario of coplanarity between the orbit and the rotation planes as initial condition for the globular cluster evolution are not longer supported (Tiongco et al. 2018). According to Eq. (9), the present-day coplanarity is observed in globular clusters with an orbital inclination  . Globular clusters with orbital inclinations lower and higher than
  rotate around an axis that is inclined with respect to the Milky Way plane and varies by up to ∼20° above or below
  , respectively. Equation (9) also allows us to predict the rotation axis inclination of a globular cluster, provided that the inclination of its orbit is known.
We tried to determine some trail of the physical origin of Eq. (9) by examining the relationships of i* − I* with different globular cluster parameters taken from Piatti (2019) and Piatti et al. (2019), when no other source is mentioned. We considered a and the orbital eccentricity to link Eq. (9) to orbital properties; the current mass (log(Mcls /M⊙)), the ratio between the mass lost by tidal disruption to the total mass (Mdis/Mini), and the ratio of the age to the half-mass relaxation time to decide whether the internal dynamical evolution plays a role; the tidal radius (rt) and the rotation strength (ξ, Sollima et al. 2019) to connect Eq. (9) to the internal rotation itself, and the status of a globular cluster according to whether it has tidal tails, extra-tidal features different from tidal tails, or simply a King (1962) profile (Piatti & Carballo-Bello 2020). Figure 3 shows some of these plots. None of them would seem to clarify that Eq. (9) correlates with any astrophysical properties of these globular cluster. For this reason, we speculate that it might be worthwhile to search for the origin of the interplay between i* and I* in some large-scale effect caused by Milky Way characteristics, such as its gravitational potential, overall magnetic field, or others.
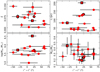 |
Fig. 3. Relative inclinations as a function of different astrophysical properties. |
4. Concluding remarks
Motivated by some recent observational results that have presented reliable orbital and rotation parameters of globular clusters, we sought for any connection between the inclination angle of the orbital plane and that of the rotation with respect to the Milky Way plane. We analyzed 15 globular clusters, which currently is the largest sample of globular clusters with comprehensive rotation studies.
Our analysis relied on the recently published rotation parameters referred to the plane of the sky and the LOS as the natural framework. From these, we transformed the rotation velocity components to the Galactic coordinate system and computed both the inclination angle of the globular cluster orbits and those of their rotation. We found that the rotation axis inclinations of current globular clusters are not aligned with those of the globular cluster orbits, nor with those of the Galactic poles. They are inclined with respect to the corresponding orbit axis inclination, which varies from ∼60° to ∼–40° when the latter increases from 0° up to 90°. Further investigations are needed in order to determine the cause of this behavior.
The linear relationship we found between the relative inclinations and the orbital inclinations provides new observational evidence that will affect future numerical simulations of the dynamics of internal globular clusters, our understanding of the interaction of globular clusters with the Milky Way, the increase in the number of globular clusters with derived rotations. Of the 156 globular clusters cataloged in Harris (1996, 2010 Edition), 62 have been studied by Sollima et al. (2019), and 15 of these have non-negligible internal rotation. This means that there should be nearly 22 more globular clusters in the Harris (1996) catalog whose internal rotation may be detected.
Acknowledgments
I thank Pavel Kroupa and Antonio Sollima for preliminary discussions about the rotation of globular clusters. I also thank the referee for the thorough reading of the manuscript and timely suggestions to improve it.
References
- Astropy Collaboration (Robitaille, T. P. et al.) 2013, A&A, 558, A33 [NASA ADS] [CrossRef] [EDP Sciences] [Google Scholar]
- Astropy Collaboration (Price-Whelan, A. M. et al.) 2018, AJ, 156, 123 [Google Scholar]
- Barros, D. A., Lépine, J. R. D., & Dias, W. S. 2016, A&A, 593, A108 [NASA ADS] [CrossRef] [EDP Sciences] [Google Scholar]
- Baumgardt, H., Hilker, M., Sollima, A., & Bellini, A. 2019, MNRAS, 482, 5138 [Google Scholar]
- Forbes, D. A., & Bridges, T. 2010, MNRAS, 404, 1203 [NASA ADS] [Google Scholar]
- Frank, M. J., Koch, A., Feltzing, S., et al. 2015, A&A, 581, A72 [NASA ADS] [CrossRef] [EDP Sciences] [Google Scholar]
- Harris, W. E. 1996, AJ, 112, 1487 [NASA ADS] [CrossRef] [Google Scholar]
- King, I. 1962, AJ, 67, 471 [NASA ADS] [CrossRef] [Google Scholar]
- Pawlowski, M. S., & Kroupa, P. 2014, ApJ, 790, 74 [NASA ADS] [CrossRef] [Google Scholar]
- Piatti, A. E. 2019, ApJ, 882, 98 [NASA ADS] [CrossRef] [Google Scholar]
- Piatti, A. E., & Carballo-Bello, J. A. 2020, A&A, 637, L2 [CrossRef] [EDP Sciences] [Google Scholar]
- Piatti, A. E., Webb, J. J., & Carlberg, R. G. 2019, MNRAS, 489, 4367 [NASA ADS] [CrossRef] [Google Scholar]
- Pryor, C., & Meylan, G. 1993, in Structure and Dynamics of Globular Clusters, eds. Djorgovski, S. G., & Meylan, G., ASP Conf. Ser., 50, 357 [Google Scholar]
- Riley, A. H., & Strigari, L. E. 2020, MNRAS, 494, 983 [NASA ADS] [CrossRef] [Google Scholar]
- Sollima, A., Baumgardt, H., & Hilker, M. 2019, MNRAS, 485, 1460 [NASA ADS] [CrossRef] [Google Scholar]
- Tiongco, M. A., Vesperini, E., & Varri, A. L. 2018, MNRAS, 475, L86 [NASA ADS] [CrossRef] [Google Scholar]
- Walker, M. G., Mateo, M., Olszewski, E. W., et al. 2006, AJ, 131, 2114 [NASA ADS] [CrossRef] [Google Scholar]
All Figures
|
Fig. 1. Relationship between orbital parameters of the globular clusters. Typical error bars are included. Black-ringed circles represent globular clusters with retrograde motions. The size of the symbols is proportional to log(a); the smallest and largest symbols correspond to a = 1.6 and 13.6 kpc, respectively. |
| In the text | |
|
Fig. 2. Relative inclination vs. orbital plane inclination for the globular clusters. Circles and squares refer to globular clusters moving around the Milky Way center or rotating in prograde and retrograde directions, respectively. Black-ringed symbols represent globular clusters with opposite direction of orbital and rotational motions. Individual error bars are indicated; those for I* are as large as the symbol sizes. The black line represents the fitted relationship (see text). |
| In the text | |
|
Fig. 3. Relative inclinations as a function of different astrophysical properties. |
| In the text | |
Current usage metrics show cumulative count of Article Views (full-text article views including HTML views, PDF and ePub downloads, according to the available data) and Abstracts Views on Vision4Press platform.
Data correspond to usage on the plateform after 2015. The current usage metrics is available 48-96 hours after online publication and is updated daily on week days.
Initial download of the metrics may take a while.