Fig. B.1.
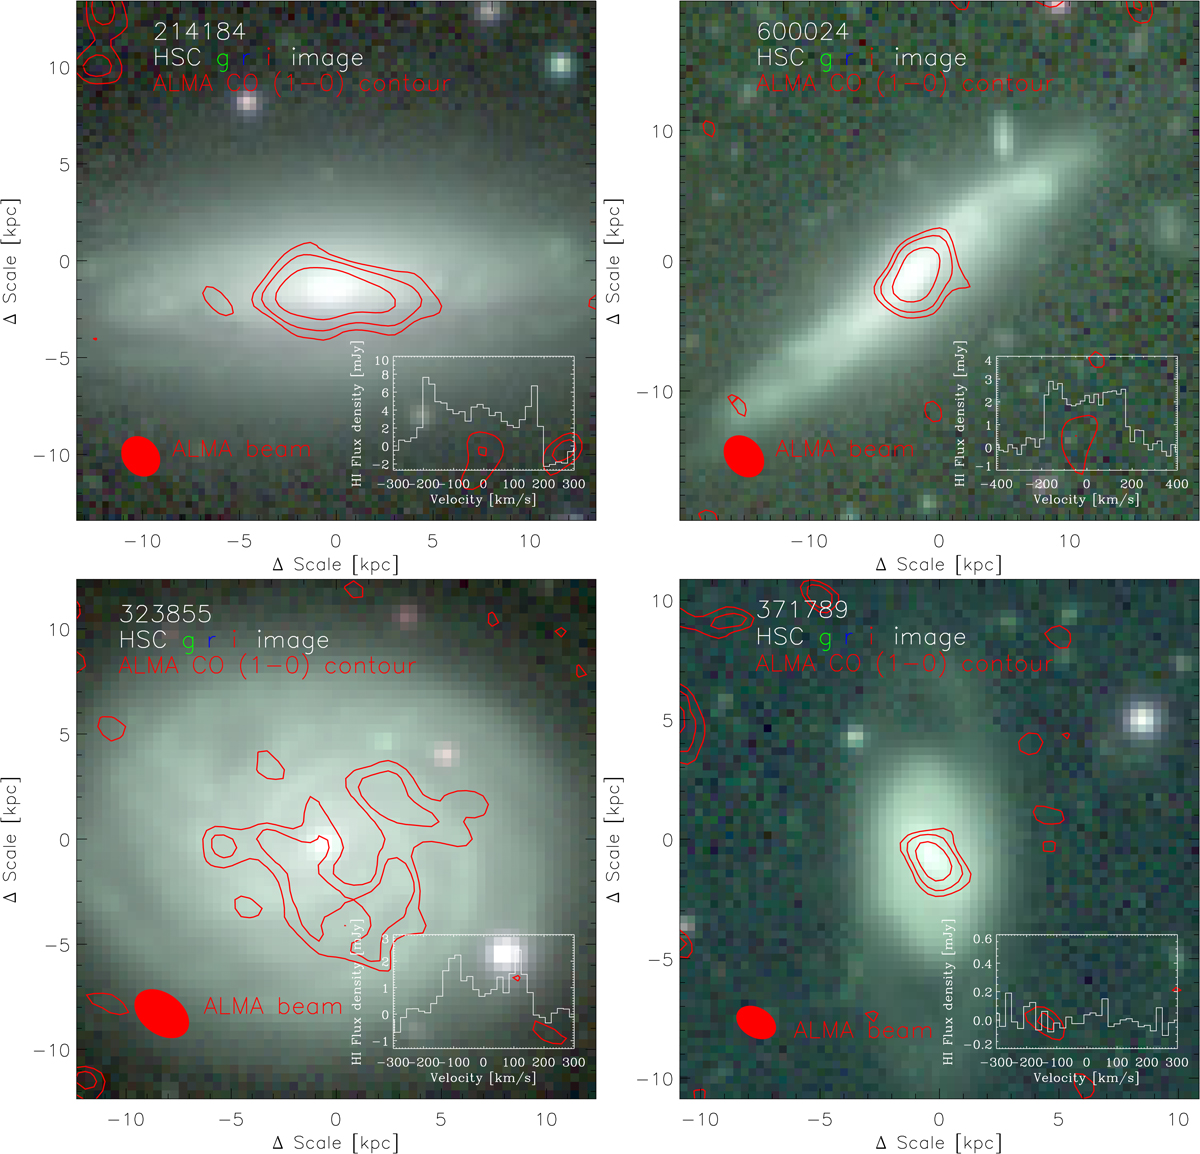
Colour images composed of g, r, i band images from the HSC survey wide fields (Aihara et al. 2019), as well as the red contour of ALMA CO (1−0) moment-zero map. The contours are shown in [2, 3, 5] × rms. We also show the H I spectrum in the 20 km s−1 velocity bin in the lower right corner of each panel. The FAST beam size (2.9 arcmin) corresponds to about 130 kpc at a redshfit of 0.05, which is much larger than the scale of the images.
Current usage metrics show cumulative count of Article Views (full-text article views including HTML views, PDF and ePub downloads, according to the available data) and Abstracts Views on Vision4Press platform.
Data correspond to usage on the plateform after 2015. The current usage metrics is available 48-96 hours after online publication and is updated daily on week days.
Initial download of the metrics may take a while.