Free Access
Fig. B.3.
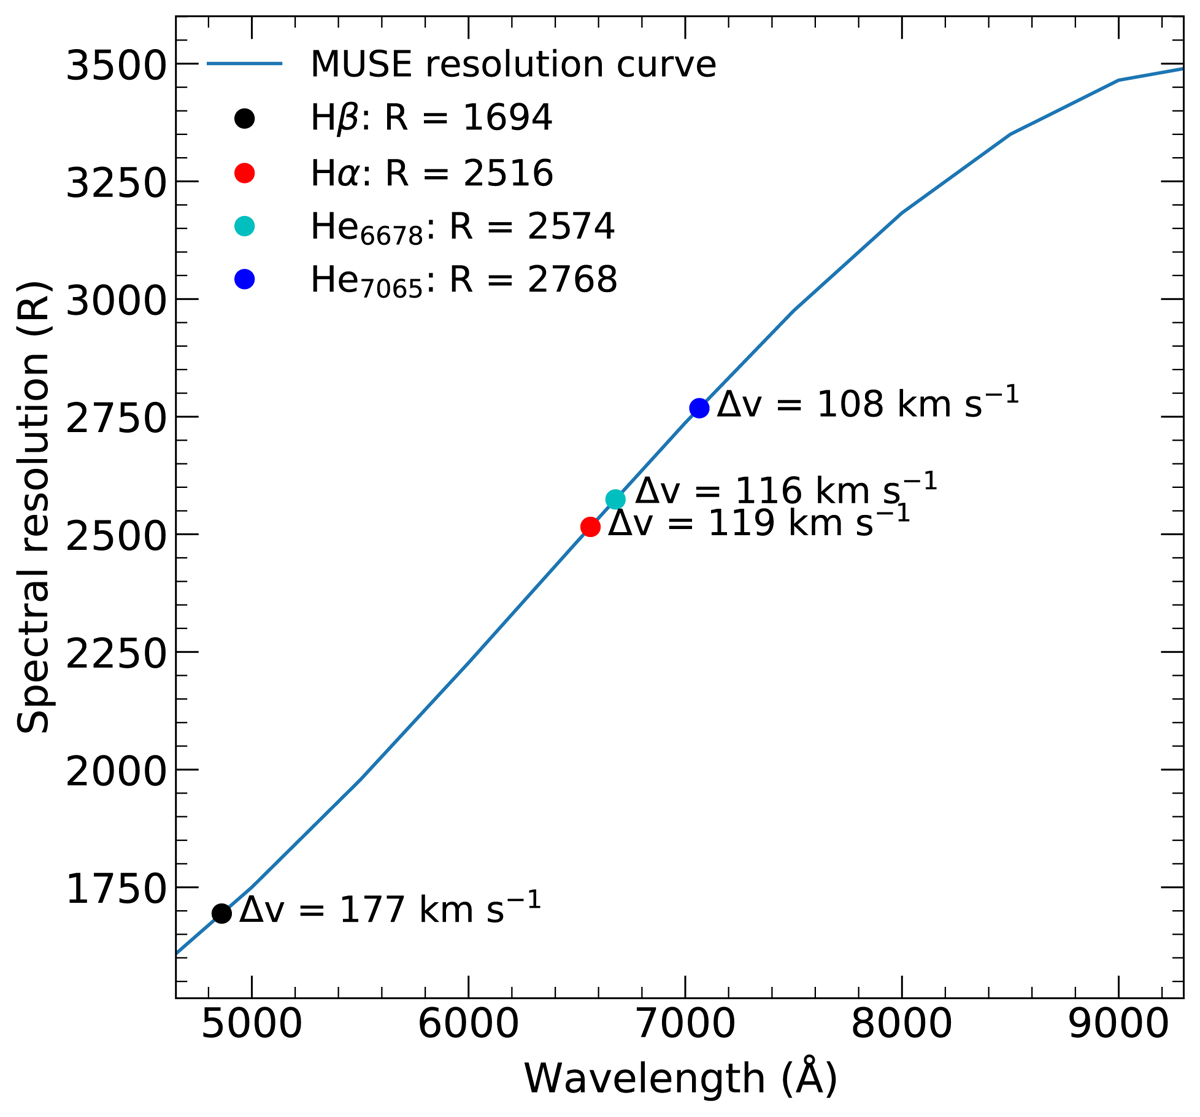
Interpolated values for R at the four emission lines used in the data analysis (coloured points). The blue line is obtained from the values listed in 500 Å increments, in the MUSE User Manual (version 11.3, Fig. 18). The Δv values given for each point represent the FWHM of the MUSE line profile at that resolution.
Current usage metrics show cumulative count of Article Views (full-text article views including HTML views, PDF and ePub downloads, according to the available data) and Abstracts Views on Vision4Press platform.
Data correspond to usage on the plateform after 2015. The current usage metrics is available 48-96 hours after online publication and is updated daily on week days.
Initial download of the metrics may take a while.