Fig. B.1.
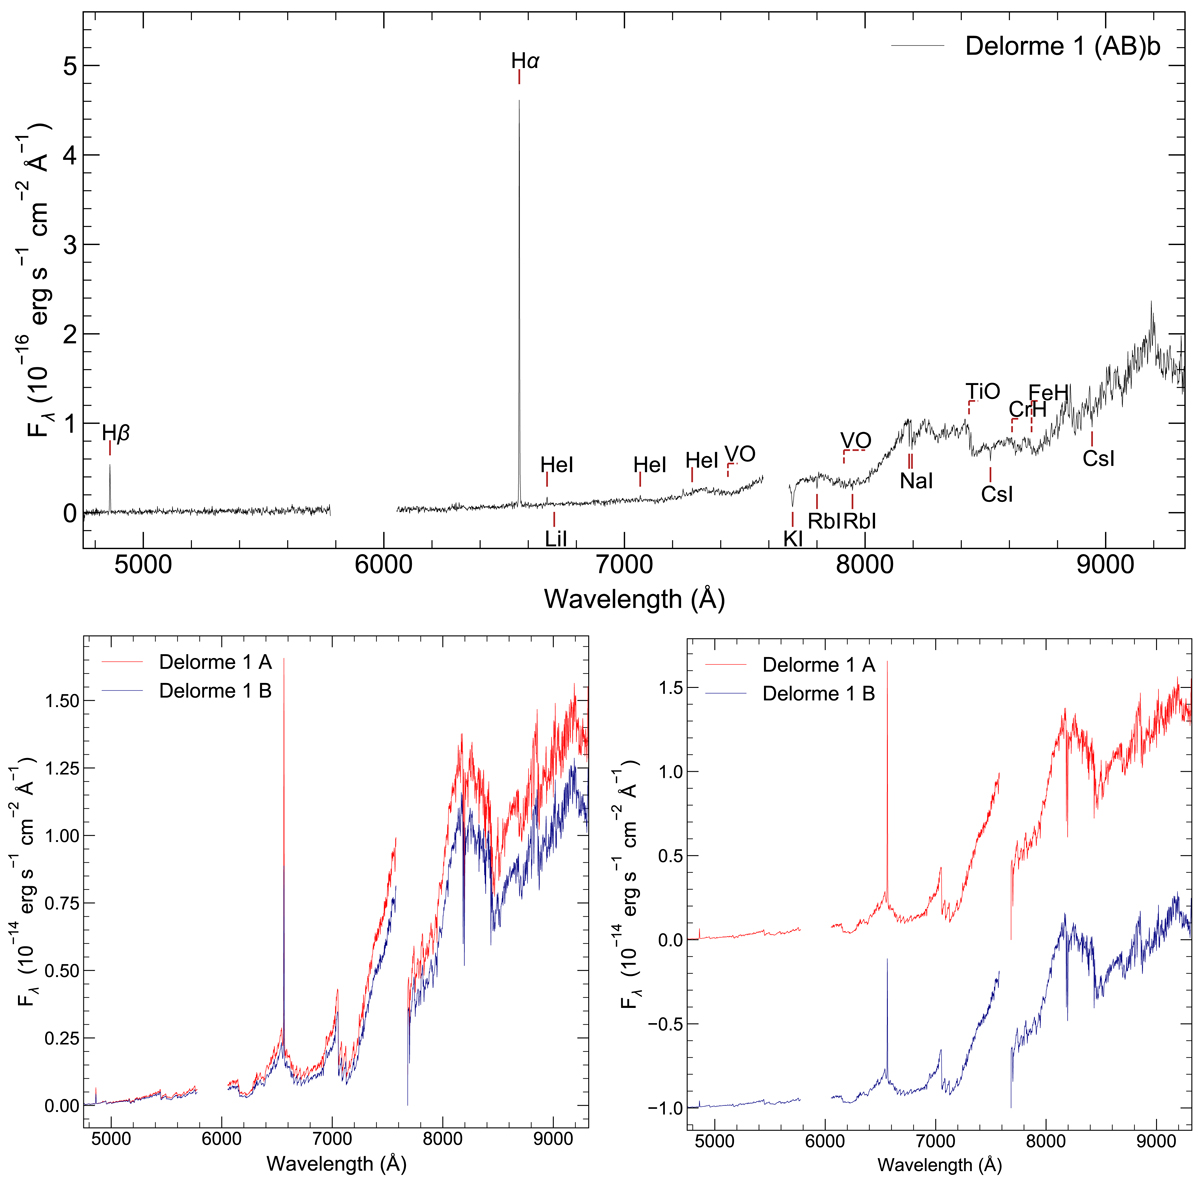
Upper panel: spectrum of Delorme 1 (AB)b as shown in Fig. 2. Bottom left: full averaged (over 12 cubes) MUSE IFS spectrum of the two components of the central binary pair, Delorme 1 AB, indicating nearly identical spectral types (∼M5 − M6). Bottom right: secondary component (B) shifted down in flux by 10−14 for clarity. Prominent features include very strong Hα and Na I doublet, and weaker Hβ lines in both components. The primary component (A) shows signs of Ca IRT emission, with the first two Ca II lines visible at 8498/8542 Å. This is likely associated with the recent flare because it is not detectable in B. We also note the lack of any He I features in the 6678−7281 Å range, in contrast to the companion spectrum. We detect a blueshift of ∼ − 15 km s−1 in the Hα line of Delorme 1 A during the flare event, which is not detected in B. We detect no significant blue- or redshift in the lines of Delorme 1 (AB)b.
Current usage metrics show cumulative count of Article Views (full-text article views including HTML views, PDF and ePub downloads, according to the available data) and Abstracts Views on Vision4Press platform.
Data correspond to usage on the plateform after 2015. The current usage metrics is available 48-96 hours after online publication and is updated daily on week days.
Initial download of the metrics may take a while.