Fig. 2.
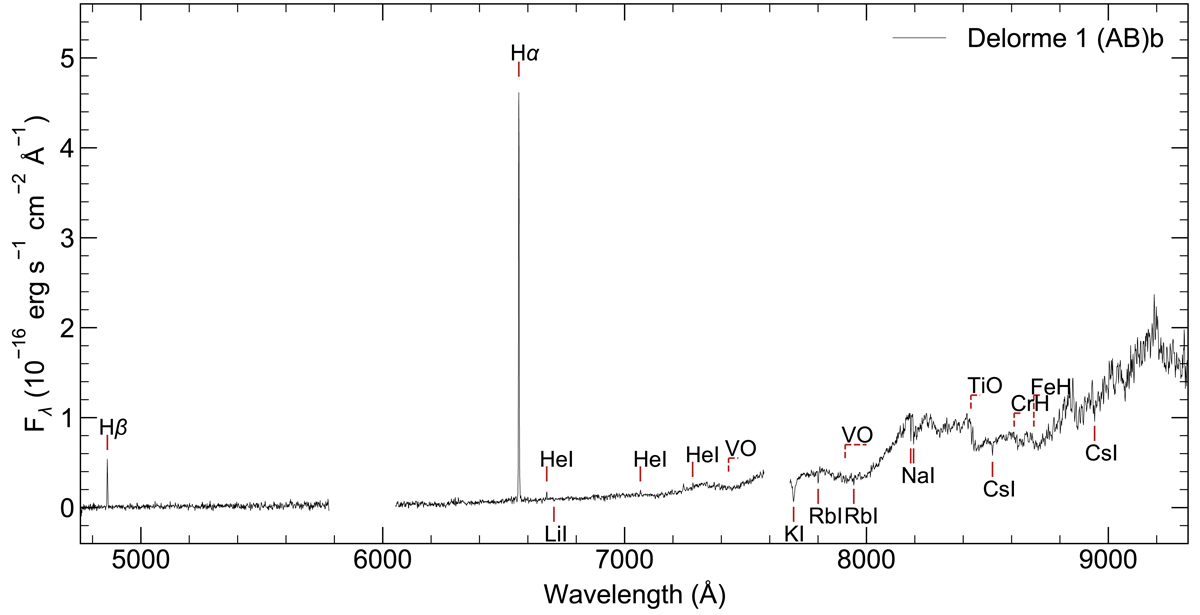
Full averaged (over 11 cubes) MUSE spectrum of the companion Delorme 1 (AB)b (black line) showing very strong Hα emission, and highlighting other atomic lines (black text and red lines) and molecular absorption features (dashed red lines). The two narrow gaps in the spectrum are caused by sections of unusable data at 5800−6051 Å and 7592−7681 Å.
Current usage metrics show cumulative count of Article Views (full-text article views including HTML views, PDF and ePub downloads, according to the available data) and Abstracts Views on Vision4Press platform.
Data correspond to usage on the plateform after 2015. The current usage metrics is available 48-96 hours after online publication and is updated daily on week days.
Initial download of the metrics may take a while.