Fig. 10
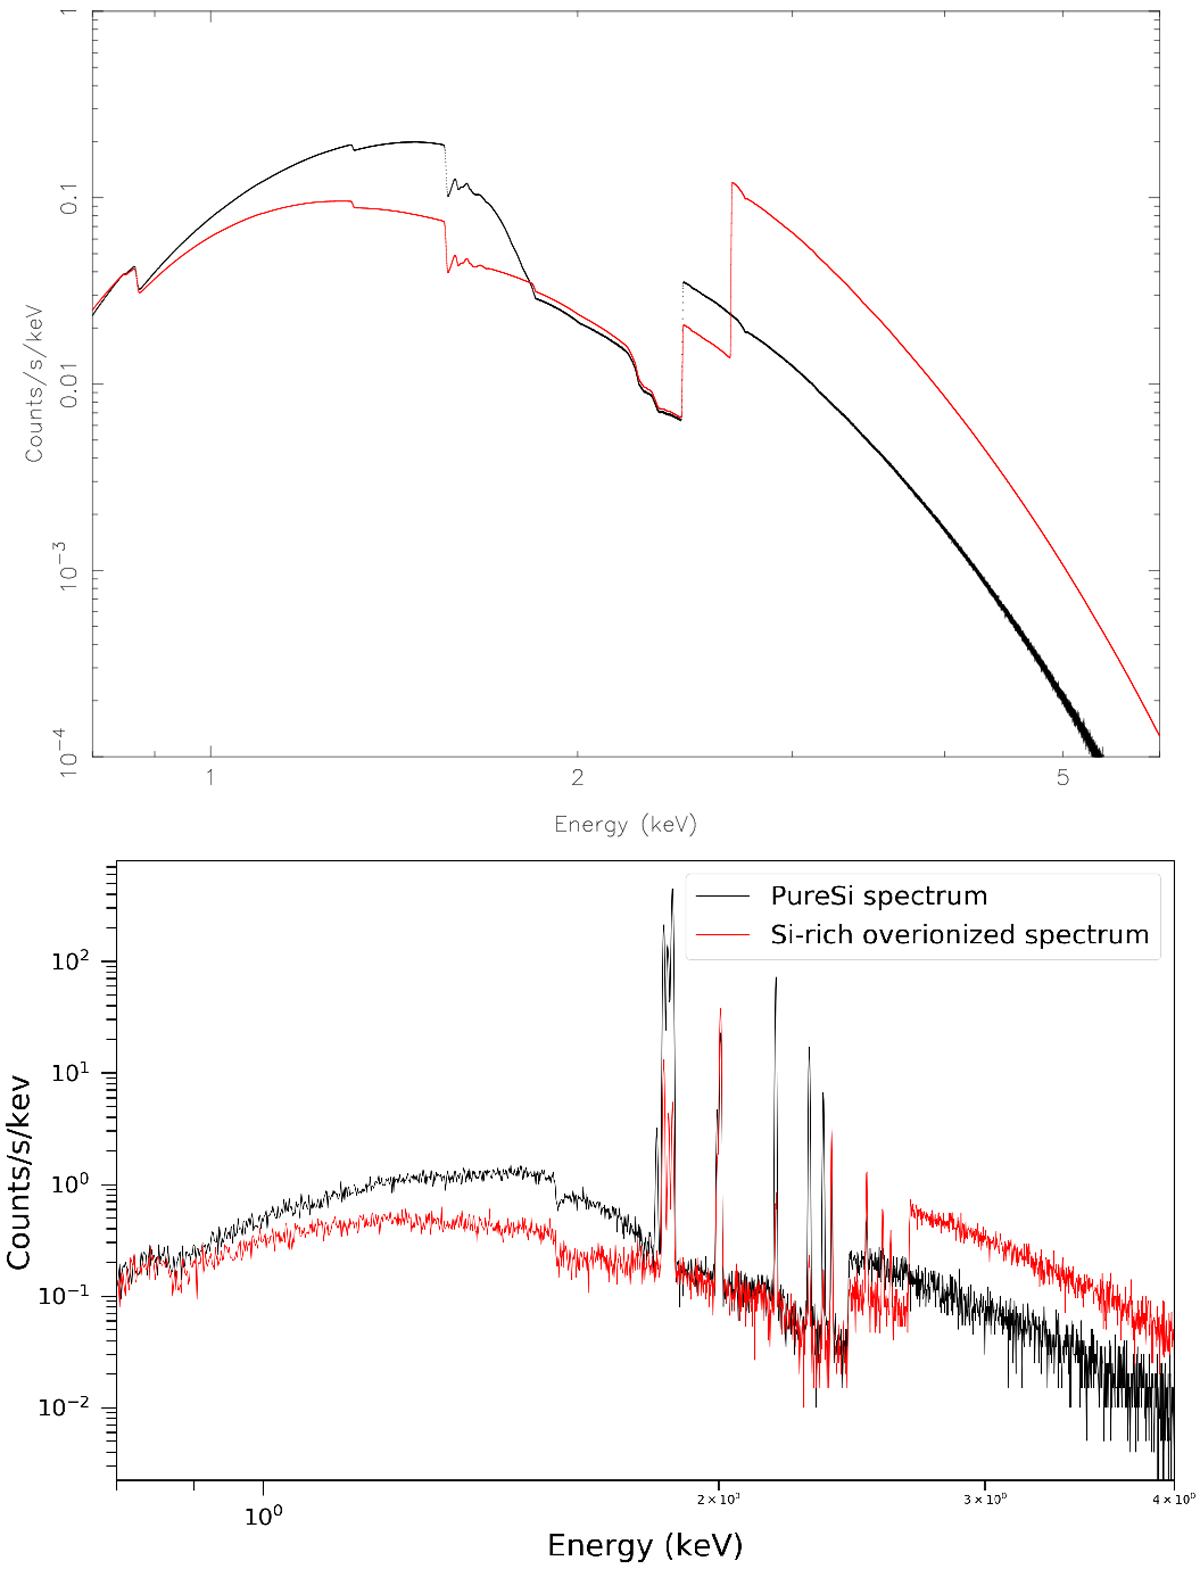
Comparison between spectra produced by a pure-metal plasma and an overionized plasma. Upper panel: in red, continuum-only spectrum of a typical overionized SNR (Si abundance set to 3, τrec = 1011 s cm−3, kTfin = 0.5 keV and kT0 = 5 keV); in black, continuum-only spectrum of a typical pure-ejecta plasma in CIE (Si abundance set to 300 and kT = 0.5 keV). Both spectra are synthesized assuming an exposure time of 108 ks. Lower panel: same as upper panel but assuming an exposure time of 100 ks and also including the line emission.
Current usage metrics show cumulative count of Article Views (full-text article views including HTML views, PDF and ePub downloads, according to the available data) and Abstracts Views on Vision4Press platform.
Data correspond to usage on the plateform after 2015. The current usage metrics is available 48-96 hours after online publication and is updated daily on week days.
Initial download of the metrics may take a while.