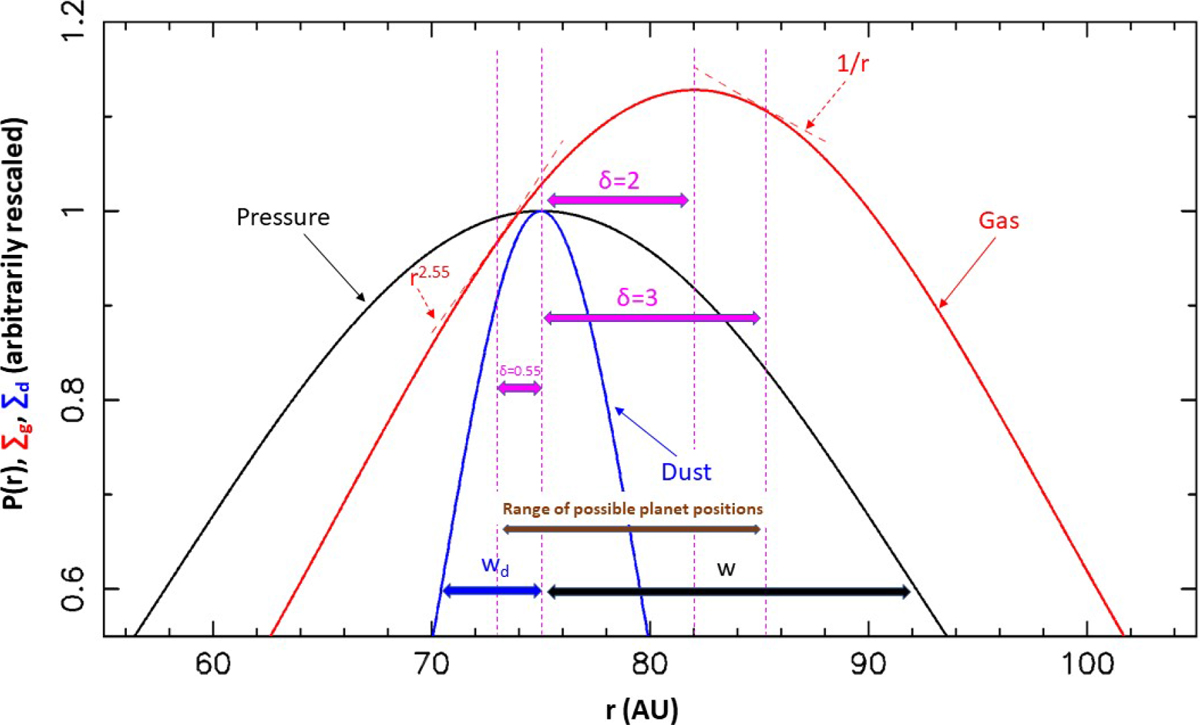
Fig. 1

Radial profiles of pressure (black), gas surface density (red), and dust surface density (blue) for the DHSARP ring B77, from Dullemond et al. (2018) – see Sect. 3. The vertical scale of each profile has been renormalized for illustrative purposes. The dashed thin red curves show the profiles r2.55 and 1∕r, and their tangential points to the red solid curve shows the locations where the gas surface density profile haslocally these profiles. These two locations delimit the range of possible positions of the planet at the migration trap, depending on the degree of saturation of the vortensity-driven corotation torque. Their distances relative to the location of the pressure maximum are given in terms of the parameter δ, as well as the location of the maximum of the gas surface-density distribution. The widths w and wd in Eqs. (1) and (4) are also graphically represented.
Current usage metrics show cumulative count of Article Views (full-text article views including HTML views, PDF and ePub downloads, according to the available data) and Abstracts Views on Vision4Press platform.
Data correspond to usage on the plateform after 2015. The current usage metrics is available 48-96 hours after online publication and is updated daily on week days.
Initial download of the metrics may take a while.


