Free Access
Fig. 2.
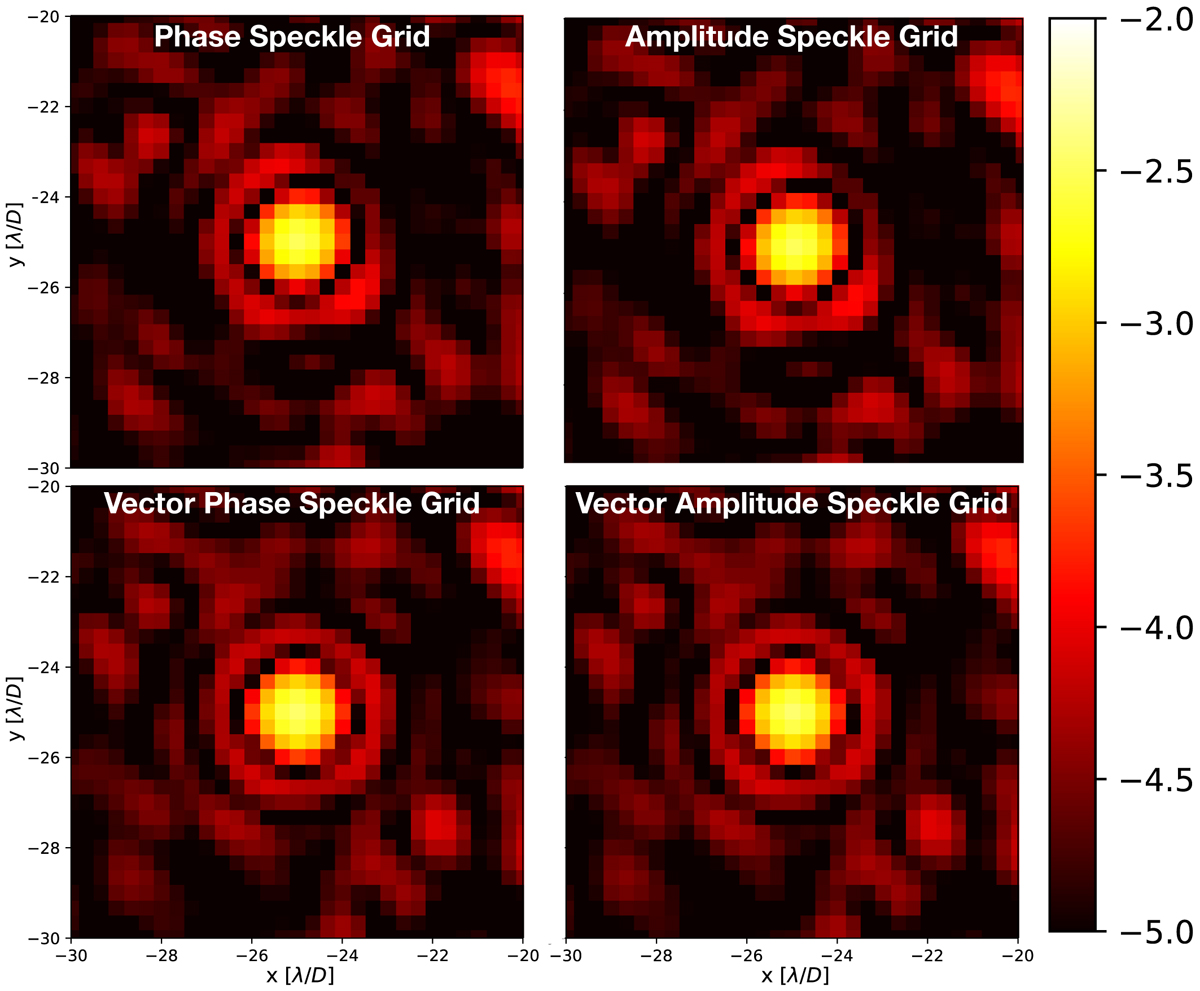
Zoom onto the reference speckles in the lower left corner of the panels in Fig. 1. The VSGs are clearly less distorted compared to the regular SGs. The images show intensity normalized to the maximum of the star in logarithmic scale, and share the same color bar (shown at the right).
Current usage metrics show cumulative count of Article Views (full-text article views including HTML views, PDF and ePub downloads, according to the available data) and Abstracts Views on Vision4Press platform.
Data correspond to usage on the plateform after 2015. The current usage metrics is available 48-96 hours after online publication and is updated daily on week days.
Initial download of the metrics may take a while.