Fig. 1.
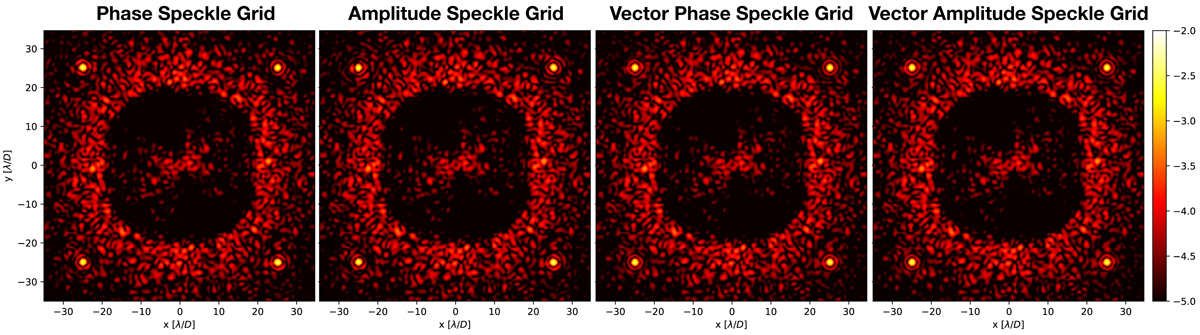
Short-exposure images at a random iteration in the simulation with the medium atmospheric conditions (seeing of 1″ and wind speed of 8.8 m s−1). The dark hole in the center of the images is generated by the AO system and the Vector Vortex Coronagraph. The reference speckles are located in the corners of the image at [±25 λ/D, ±25 λ/D]. We note that the reference speckles generated by the VPSG and VASG are significantly less distorted and more similar to each other compared to the Phase and Amplitude Speckle Grids. The images show intensity normalized to the maximum of the star in logarithmic scale, and share the same color bar (shown at the right).
Current usage metrics show cumulative count of Article Views (full-text article views including HTML views, PDF and ePub downloads, according to the available data) and Abstracts Views on Vision4Press platform.
Data correspond to usage on the plateform after 2015. The current usage metrics is available 48-96 hours after online publication and is updated daily on week days.
Initial download of the metrics may take a while.