Free Access
Fig. 6.
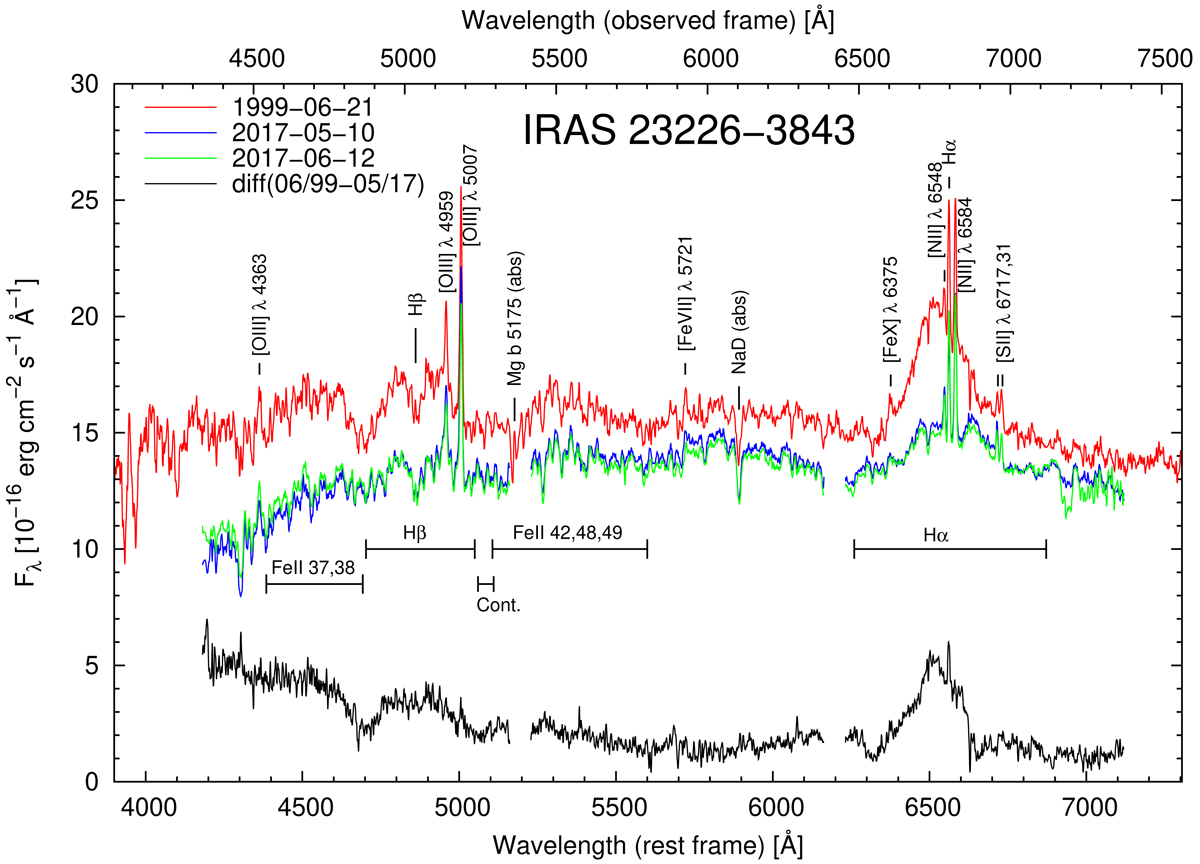
Optical spectra of IRAS 23226-3843 taken in 2017 as well as in 1999. The spectrum at the bottom gives the difference between the spectra taken in 1999 and May, 2017.
Current usage metrics show cumulative count of Article Views (full-text article views including HTML views, PDF and ePub downloads, according to the available data) and Abstracts Views on Vision4Press platform.
Data correspond to usage on the plateform after 2015. The current usage metrics is available 48-96 hours after online publication and is updated daily on week days.
Initial download of the metrics may take a while.