Fig. 4.
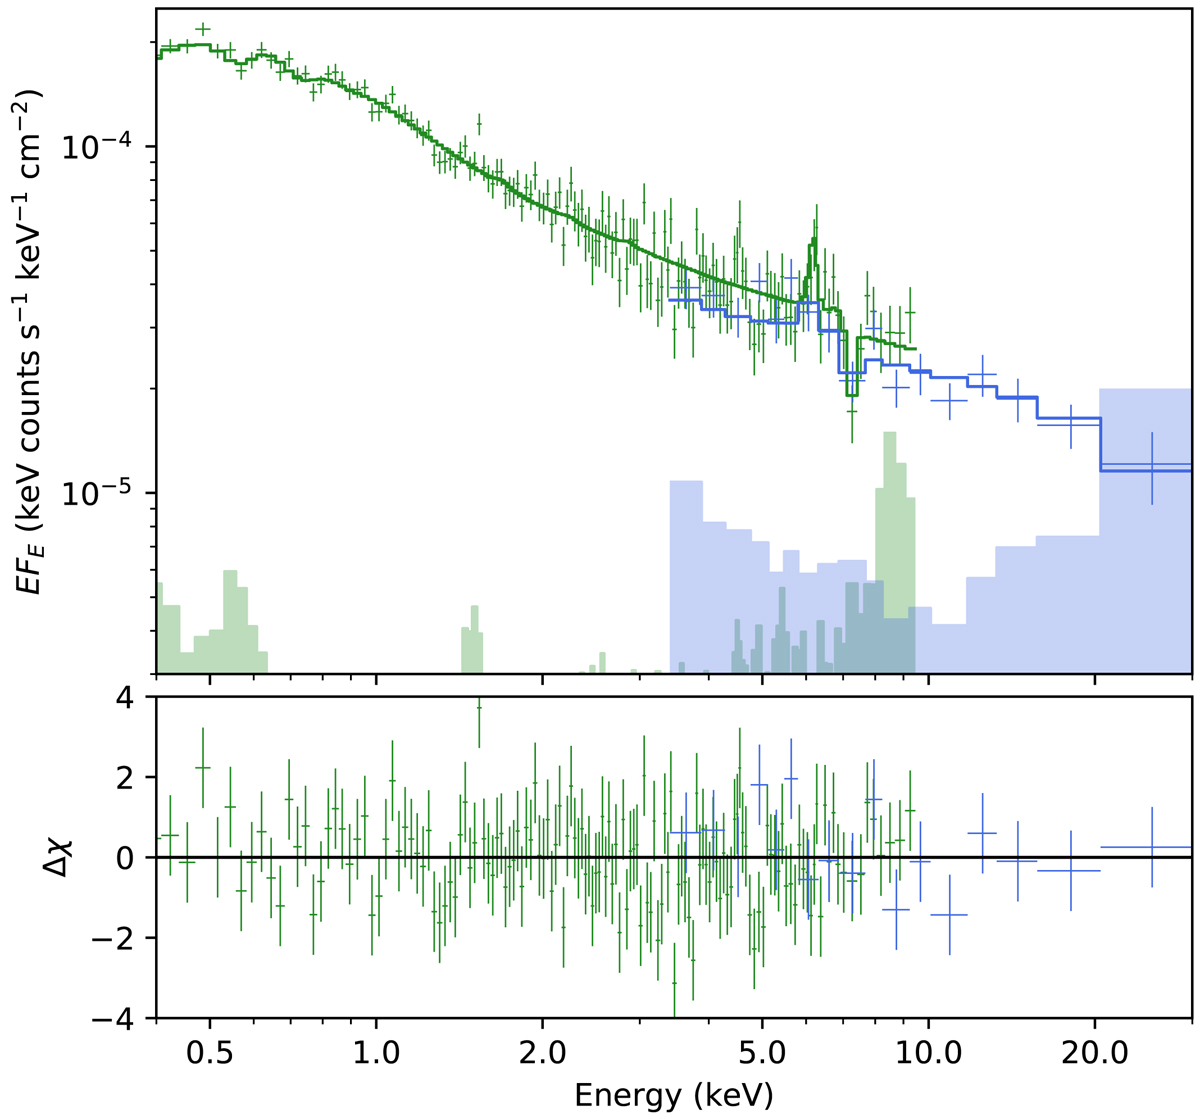
XMM-Newton and NuSTAR spectrum of IRAS 23226-3843. The data are corrected for the effective area of the instruments (using the “setplot area” command in XSPEC) but are not unfolded. Solid lines show the best-fit model, and shaded regions show the background spectra. The lower panel shows the residuals to the best-fit model. For clarity, we show only the EPIC-pn and NuSTAR data. The two NuSTAR FPM spectra are grouped for clarity in the figure, but fitted separately.
Current usage metrics show cumulative count of Article Views (full-text article views including HTML views, PDF and ePub downloads, according to the available data) and Abstracts Views on Vision4Press platform.
Data correspond to usage on the plateform after 2015. The current usage metrics is available 48-96 hours after online publication and is updated daily on week days.
Initial download of the metrics may take a while.