Open Access
Fig. 9.
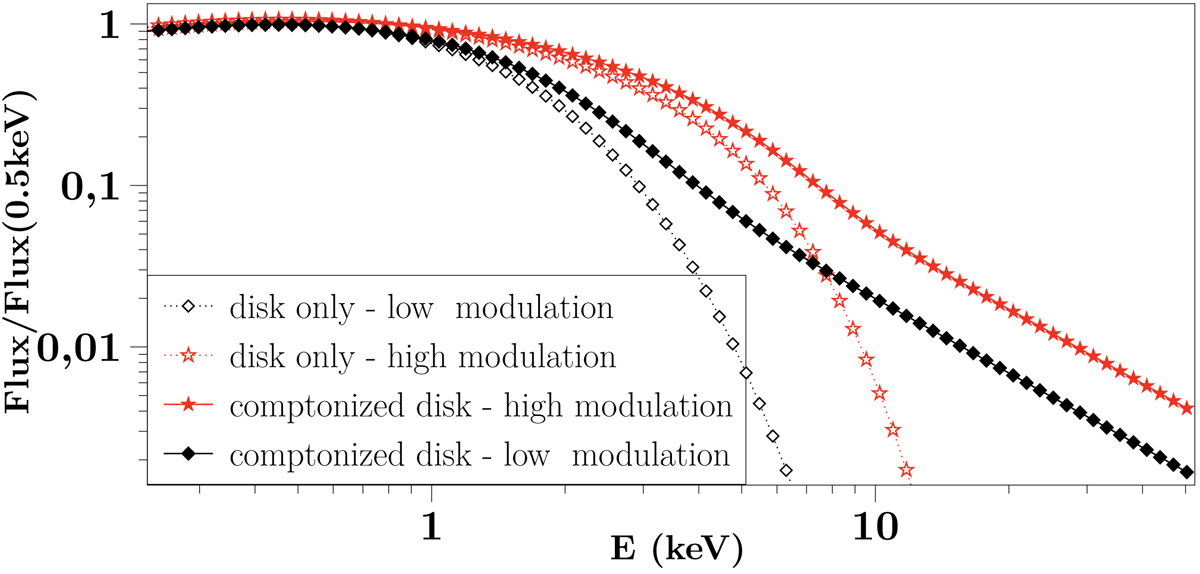
Thermal and comptonised spectra of the high (red star) and low (black star) states of the RWI flux in late times of the simulation. All fluxes are normalised to their value at 0.5 keV in order to simplify comparisons.
Current usage metrics show cumulative count of Article Views (full-text article views including HTML views, PDF and ePub downloads, according to the available data) and Abstracts Views on Vision4Press platform.
Data correspond to usage on the plateform after 2015. The current usage metrics is available 48-96 hours after online publication and is updated daily on week days.
Initial download of the metrics may take a while.