Fig. B.1
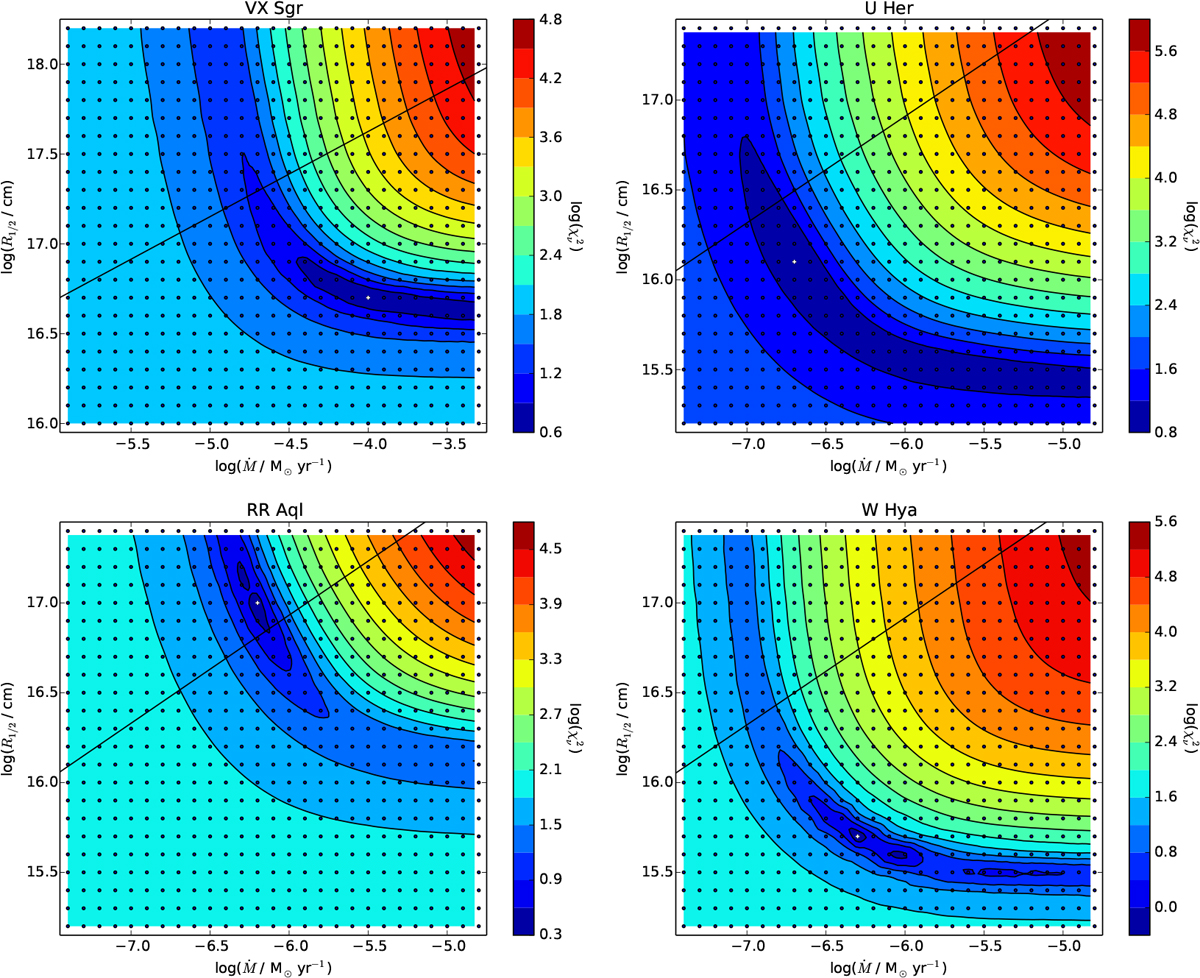
Grid of mass loss rate modelling for VX Sgr, U Her, RR Aql, and W Hya. The contours represent the base-10 logarithm of the reduced ![]() -value from the fitting of CO lines. The horizontal axis describes the mass loss rate variation and along the vertical axis the CO photo-dissociation radius (R1∕2) is varied. The black dots indicate the grid values and the white cross indicates the best fit values. The solid line represents the CO photo-dissociation radius vs. mass loss dependence as predicted by Mamon et al. (1988).
-value from the fitting of CO lines. The horizontal axis describes the mass loss rate variation and along the vertical axis the CO photo-dissociation radius (R1∕2) is varied. The black dots indicate the grid values and the white cross indicates the best fit values. The solid line represents the CO photo-dissociation radius vs. mass loss dependence as predicted by Mamon et al. (1988).
Current usage metrics show cumulative count of Article Views (full-text article views including HTML views, PDF and ePub downloads, according to the available data) and Abstracts Views on Vision4Press platform.
Data correspond to usage on the plateform after 2015. The current usage metrics is available 48-96 hours after online publication and is updated daily on week days.
Initial download of the metrics may take a while.