Free Access
Fig. 17
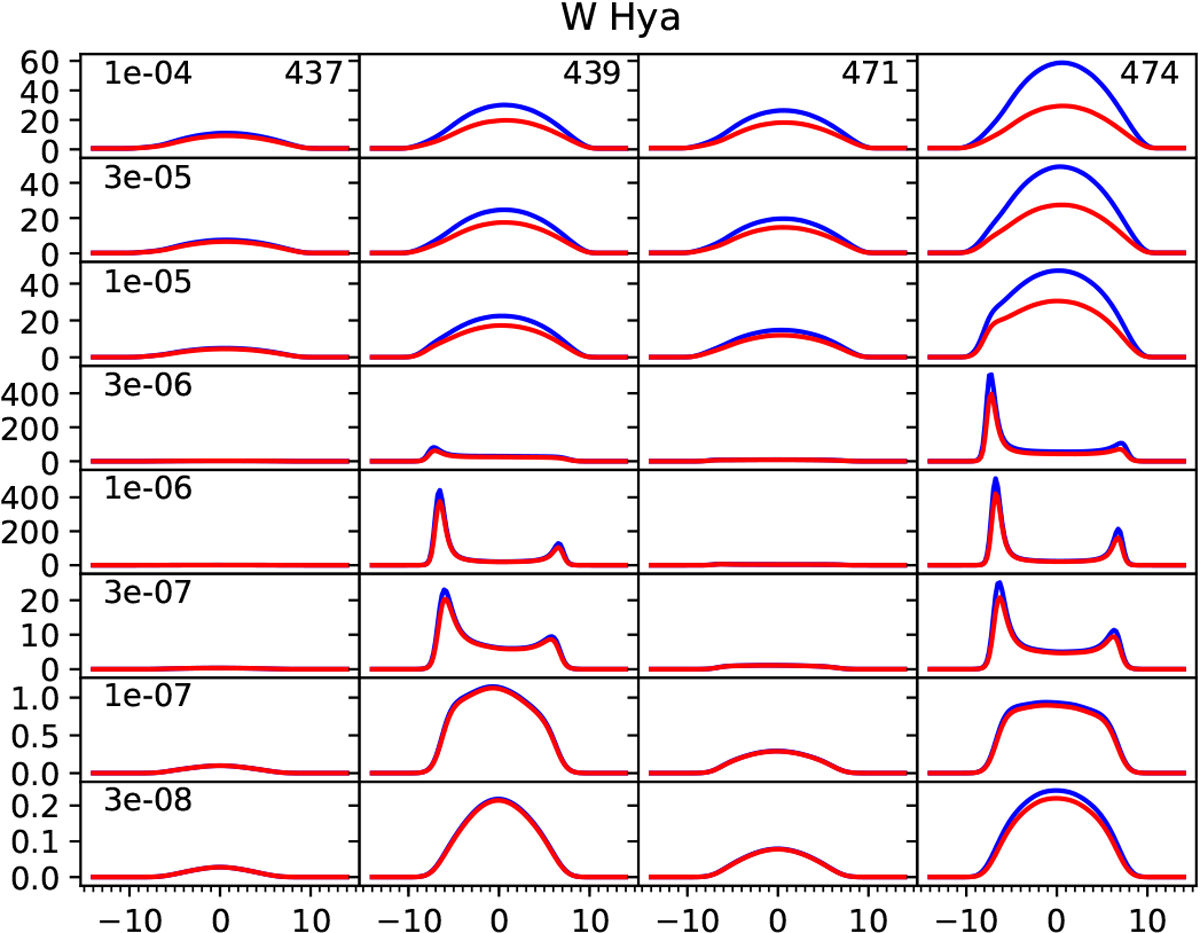
Model water spectra of the 400 GHz lines for W Hya. The layout and scales are as in Fig. 16. The strongest maser activity is found for Ṁ = (1−3) × 10−6 M⊙ yr−1. The mass loss rate derived from the CO lines is 5 × 10⁻⁷ M⊙ yr−1.
Current usage metrics show cumulative count of Article Views (full-text article views including HTML views, PDF and ePub downloads, according to the available data) and Abstracts Views on Vision4Press platform.
Data correspond to usage on the plateform after 2015. The current usage metrics is available 48-96 hours after online publication and is updated daily on week days.
Initial download of the metrics may take a while.