Fig. 16
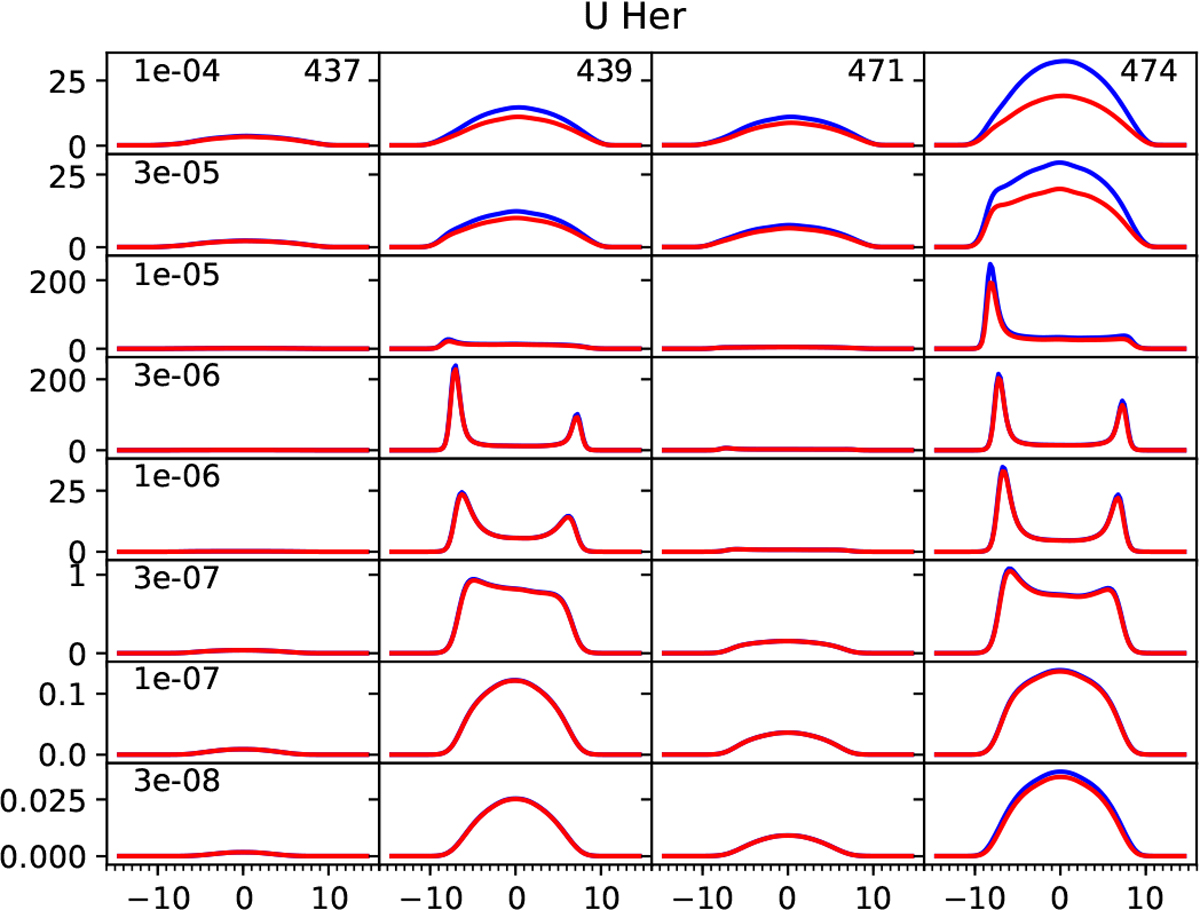
Model water spectra of the 400 GHz lines in the case of U Her. The frequency is shown in the top row spectra in gigahertz. Each row of spectra corresponds to the mass loss rate indicated in the leftmost spectrum. The blue profiles correspond to re = 0.8 R and the red profiles to re = 0.1 R. The vertical scale, in Janskys, is different for each mass loss rate. The horizontal scale is in velocity (km s−1). The strongest maser activity is found for Ṁ = 3 × 10⁻⁶ M⊙ yr−1 and is absent for the highest mass loss rates. The mass loss rate derived from the CO lines is 2 × 10⁻⁷ M⊙ yr−1.
Current usage metrics show cumulative count of Article Views (full-text article views including HTML views, PDF and ePub downloads, according to the available data) and Abstracts Views on Vision4Press platform.
Data correspond to usage on the plateform after 2015. The current usage metrics is available 48-96 hours after online publication and is updated daily on week days.
Initial download of the metrics may take a while.