Fig. 13
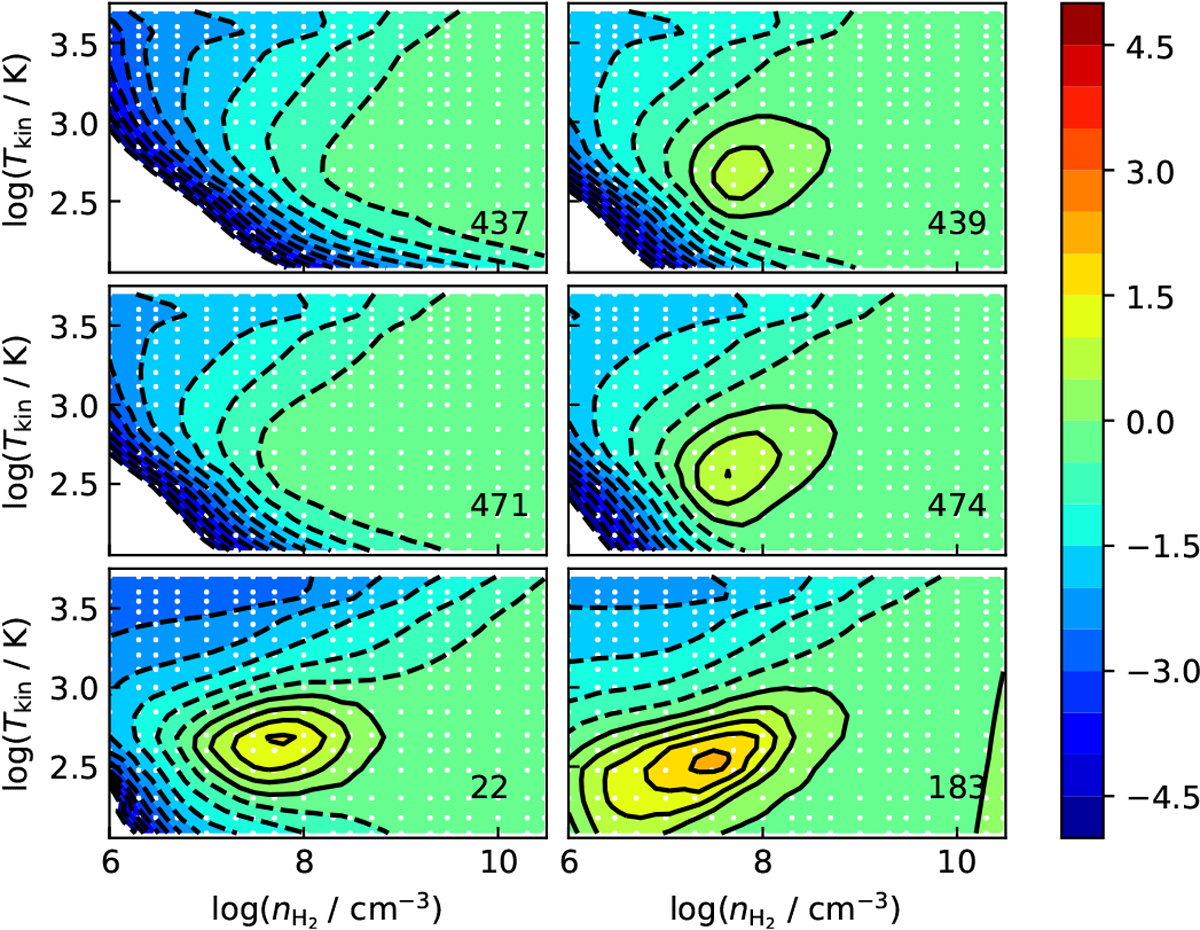
Homogeneous cloud water grid models with Rgd = 100 and Tdust = Tkin and no central source. The white dots indicate the grid points for which models were run. The transition frequency is shown in each panel in gigahertz. The line intensities for each line are described by a base-10 logarithmic contour and colour scale which is normalised to the 557 GHz line intensity (Iν ∕I557). The green area depicts the region where the line in question has a similar strength to the 557 GHz line. The maximum intensity of the 183 GHz line, which occurs around Tkin = 300 K and n(H2) = 3 × 107 cm−3, is about 102 times stronger than the 557 GHz line intensity.
Current usage metrics show cumulative count of Article Views (full-text article views including HTML views, PDF and ePub downloads, according to the available data) and Abstracts Views on Vision4Press platform.
Data correspond to usage on the plateform after 2015. The current usage metrics is available 48-96 hours after online publication and is updated daily on week days.
Initial download of the metrics may take a while.