Fig. 1.
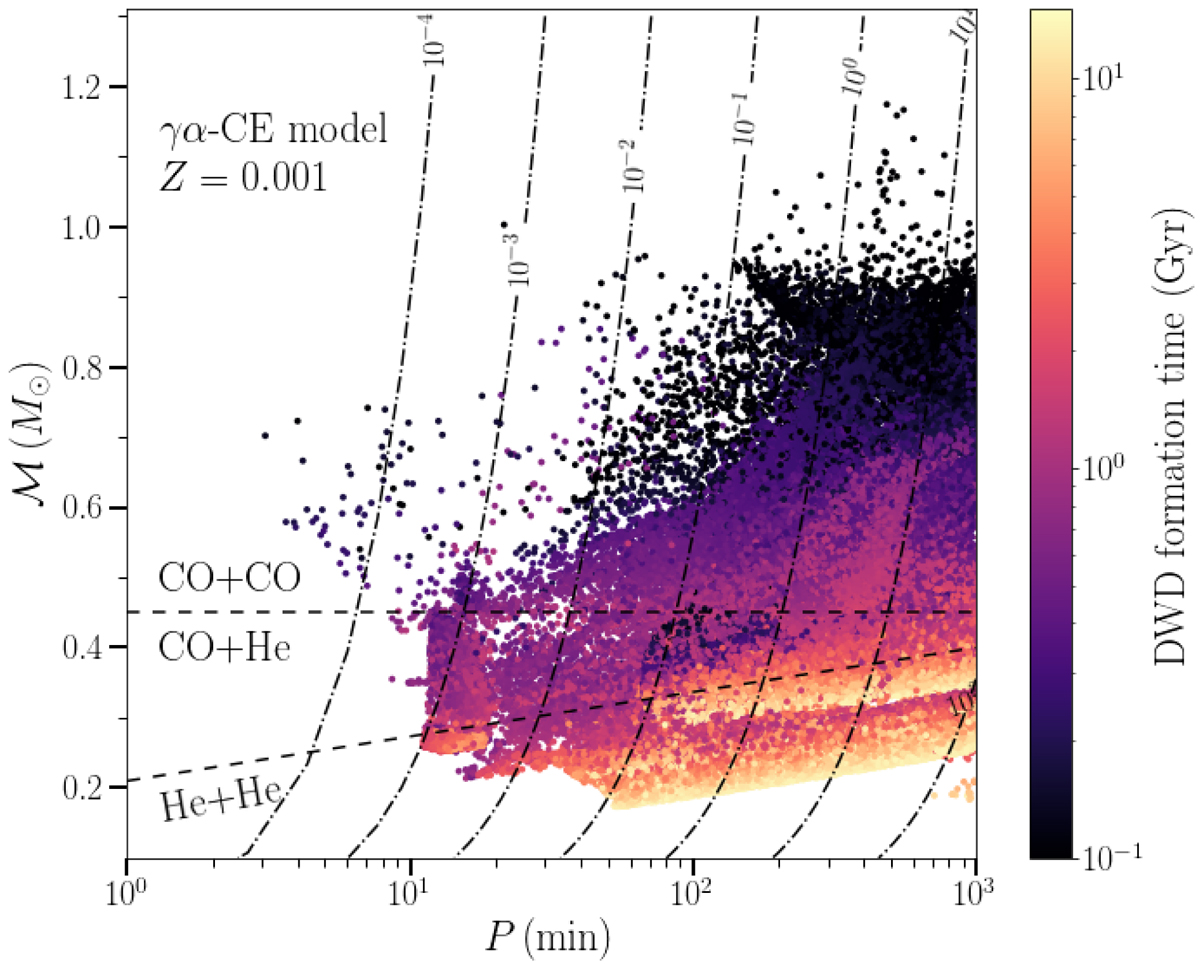
Orbital periods P and chirp mass ℳ of DWDs at birth. The DWD formation time is represented by the colour scale, while their merger time by GW emission is represented by dashed-dotted contours (both timescales are expressed in Gyr). The figure shows only a fraction of the population with orbital periods accessible to LISA. Dashed lines represent approximate boundaries between DWDs of different types: CO+CO, CO+He and He+He; ONe white dwarfs represent a negligible fraction of the population and occupy the same part of the parameter space as CO+He ones. We also note that DWDs in this figure do not encode any information about the type of the host galaxy.
Current usage metrics show cumulative count of Article Views (full-text article views including HTML views, PDF and ePub downloads, according to the available data) and Abstracts Views on Vision4Press platform.
Data correspond to usage on the plateform after 2015. The current usage metrics is available 48-96 hours after online publication and is updated daily on week days.
Initial download of the metrics may take a while.