Fig. 7.
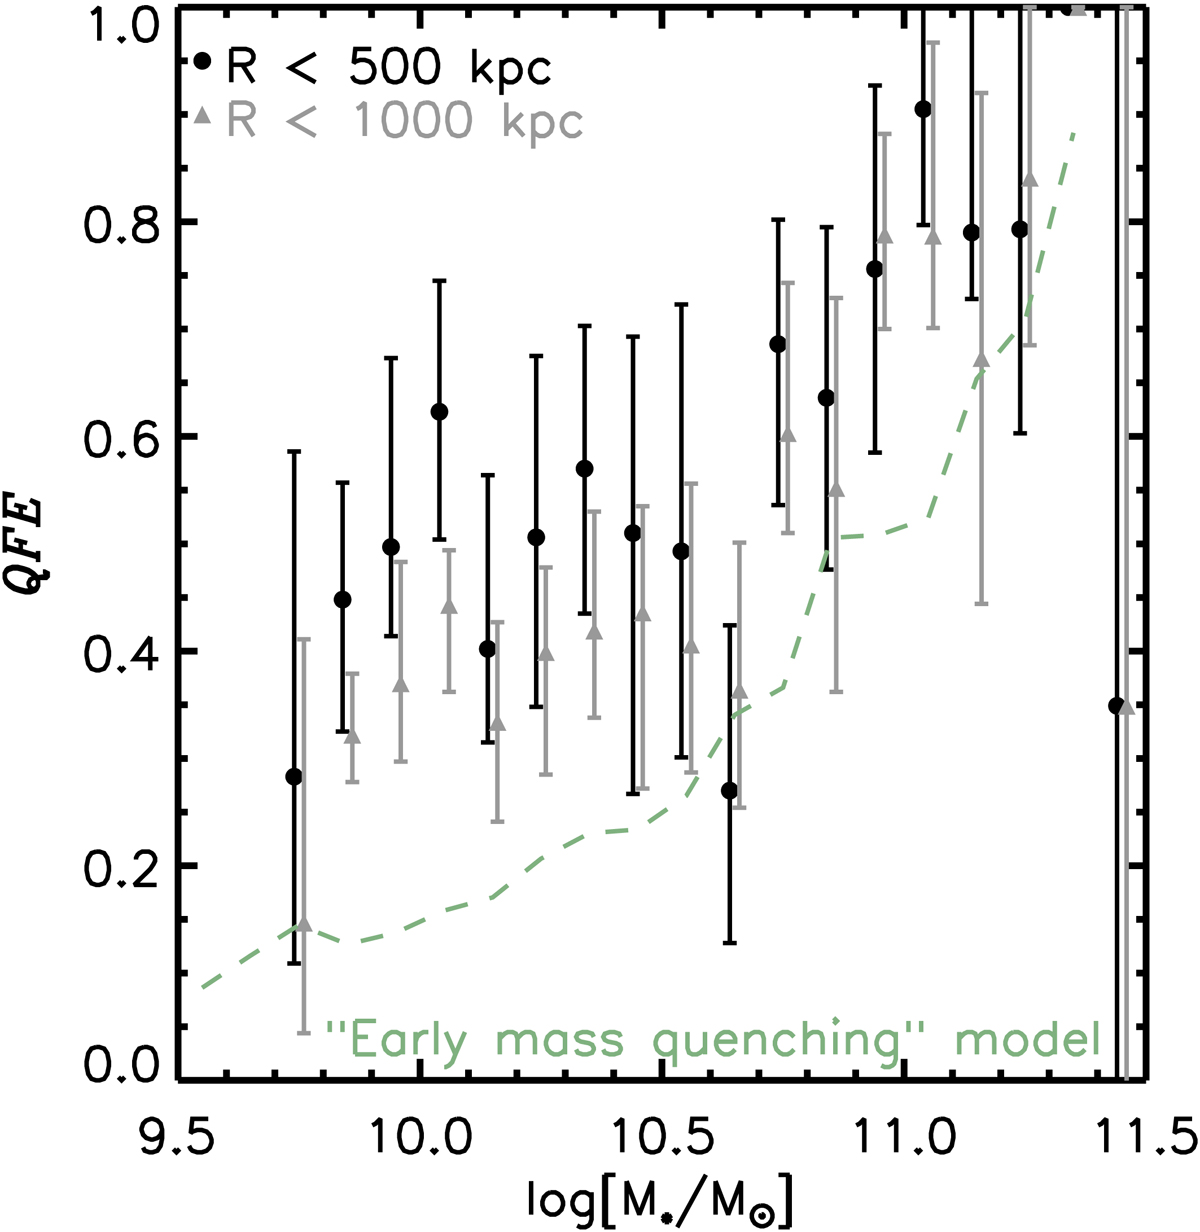
Quenched fraction excess for cluster galaxies as a function of stellar mass. Black: considering cluster galaxies at R < 500 kpc. Grey: considering cluster galaxies at R < 1000 kpc. Green dashed: galaxy evolution model as described in Sect. 5.2, where the field and cluster galaxies have started forming at different redshifts.
Current usage metrics show cumulative count of Article Views (full-text article views including HTML views, PDF and ePub downloads, according to the available data) and Abstracts Views on Vision4Press platform.
Data correspond to usage on the plateform after 2015. The current usage metrics is available 48-96 hours after online publication and is updated daily on week days.
Initial download of the metrics may take a while.