Fig. 6.
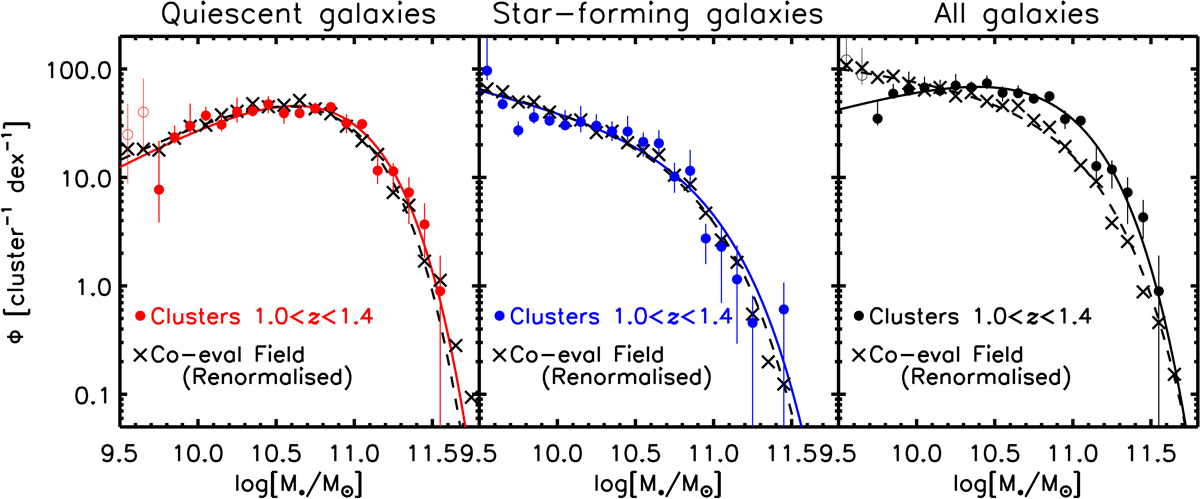
Left: SMF function of quiescent galaxies in the cluster environment (R < 1000 kpc), compared to the field. The cluster data points are identical to those shown in Fig. 4, while the field is normalised so that it integrates to the same number of quiescent galaxies down to M⋆ ≥ 109.5 M⊙. Middle: same but for star-forming galaxies. The best-fitting Schechter functions are over-plotted. The resemblance in the shapes of the separate (quiescent vs. star-forming galaxies) SMFs is evident. Right: same comparison but for all galaxies, where there is clearly a different SMF between cluster and field.
Current usage metrics show cumulative count of Article Views (full-text article views including HTML views, PDF and ePub downloads, according to the available data) and Abstracts Views on Vision4Press platform.
Data correspond to usage on the plateform after 2015. The current usage metrics is available 48-96 hours after online publication and is updated daily on week days.
Initial download of the metrics may take a while.