Fig. 5.
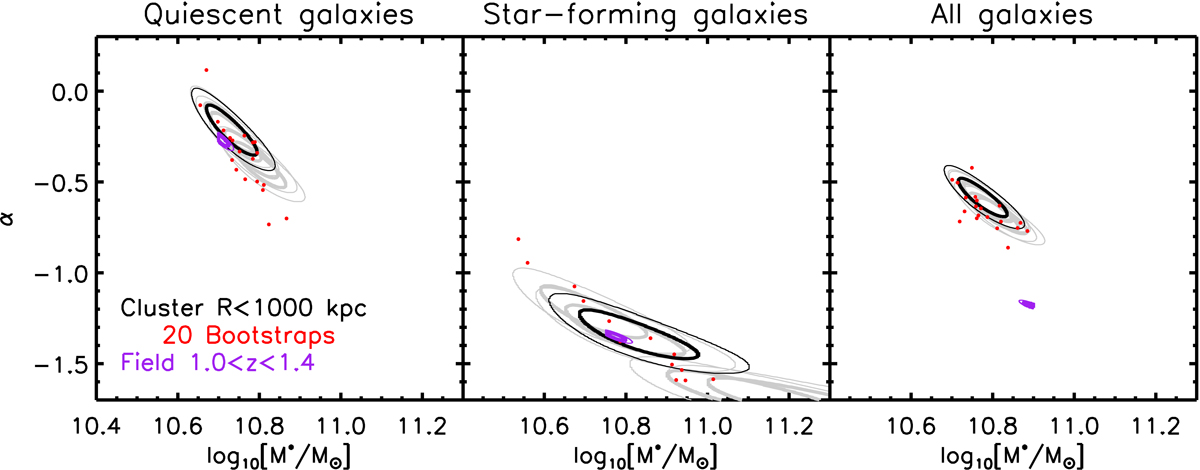
Comparison of the best-fitting Schechter parameters between cluster and field, when the galaxy population is divided between different galaxy types. Black contours: 1- and 2-σ uncertainties corresponding to the main analysis. Grey: robustness tests based on different initial photometric selection of cluster members. Red dots: results based on cluster bootstrap samples, where clusters are drawn with replacement. Purple contours: 1- and 2-σ uncertainties for the co-eval reference field.
Current usage metrics show cumulative count of Article Views (full-text article views including HTML views, PDF and ePub downloads, according to the available data) and Abstracts Views on Vision4Press platform.
Data correspond to usage on the plateform after 2015. The current usage metrics is available 48-96 hours after online publication and is updated daily on week days.
Initial download of the metrics may take a while.