Fig. 4.
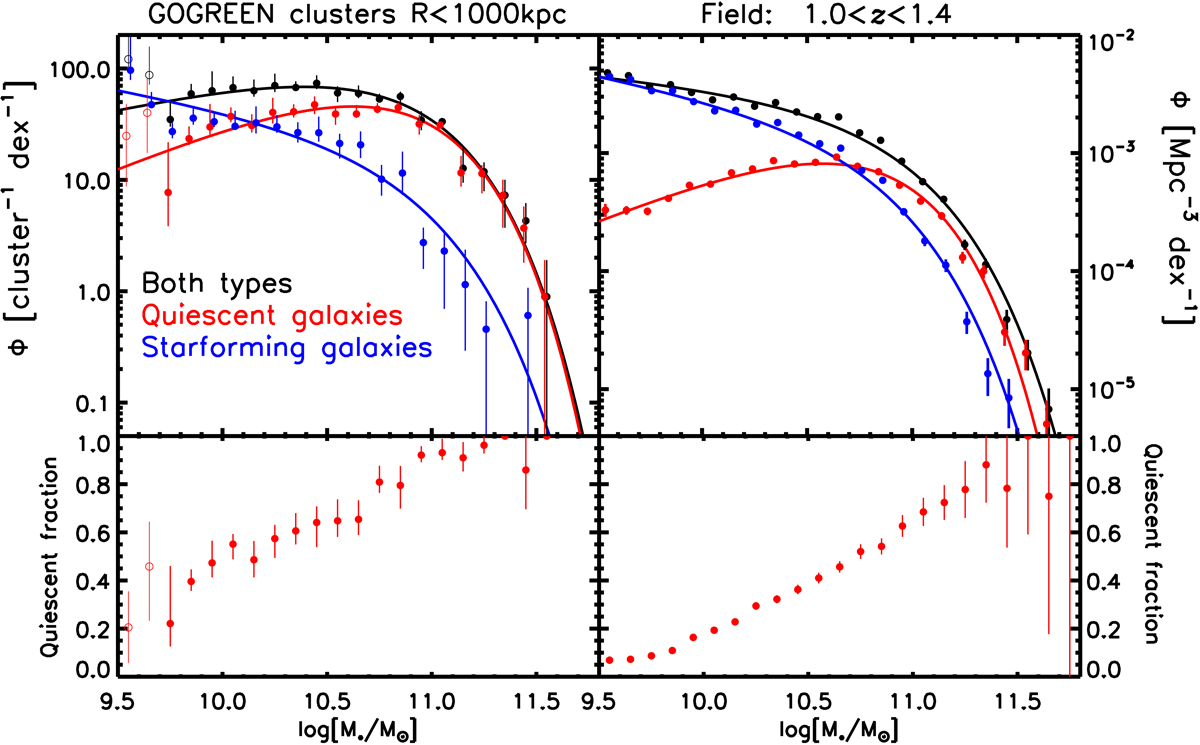
Top left panel: SMF of cluster galaxies within R ≤ 1000 kpc from the cluster centres. Black points: total galaxy population. Blue and red data points: population of star-forming and quiescent galaxies, respectively. Small horizontal offsets have been applied compared to the black points for better visibility. The open circles mark points below the 80% mass completeness limit, and even though we perform an incompleteness correction these are not used in the fitting. Top right panel: SMF of co-eval field galaxies from the COSMOS/UltraVISTA survey (1.0 < z < 1.4). The best-fitting Schechter functions are included in both top panels. Lower panels: relative fraction of quiescent galaxies as a function of stellar mass in the different environments.
Current usage metrics show cumulative count of Article Views (full-text article views including HTML views, PDF and ePub downloads, according to the available data) and Abstracts Views on Vision4Press platform.
Data correspond to usage on the plateform after 2015. The current usage metrics is available 48-96 hours after online publication and is updated daily on week days.
Initial download of the metrics may take a while.