Fig. 2.
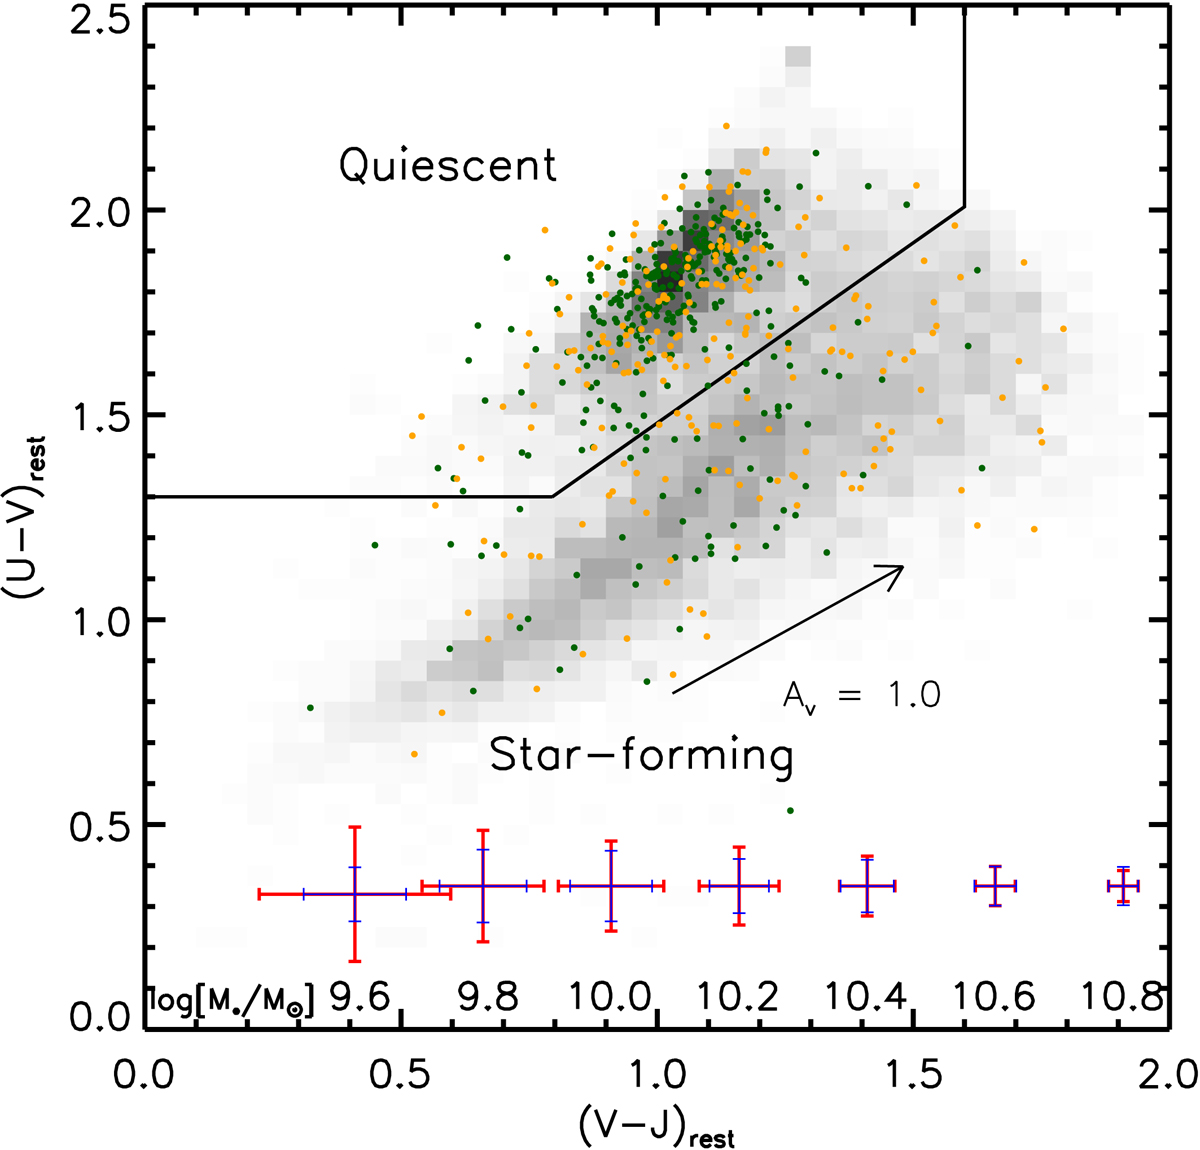
Rest-frame U − V vs. V − J diagram for galaxies compiled from all clusters, with stellar masses M⋆ ≥ 1010 M⊙ and within projected R ≤ 1000 kpc. Green: spectroscopic cluster members with |Δzspec| ≤0.02. Orange: photometric cluster members with |Δzphot| ≤0.08. Grey distribution: UltraVISTA field galaxies with redshifts 1.0 < z < 1.4 in the same mass range. The error bars present typical uncertainties at the depth of our photometry for different stellar masses, and separately for quiescent (red) and star-forming (blue) galaxies.
Current usage metrics show cumulative count of Article Views (full-text article views including HTML views, PDF and ePub downloads, according to the available data) and Abstracts Views on Vision4Press platform.
Data correspond to usage on the plateform after 2015. The current usage metrics is available 48-96 hours after online publication and is updated daily on week days.
Initial download of the metrics may take a while.