Fig. A.2.
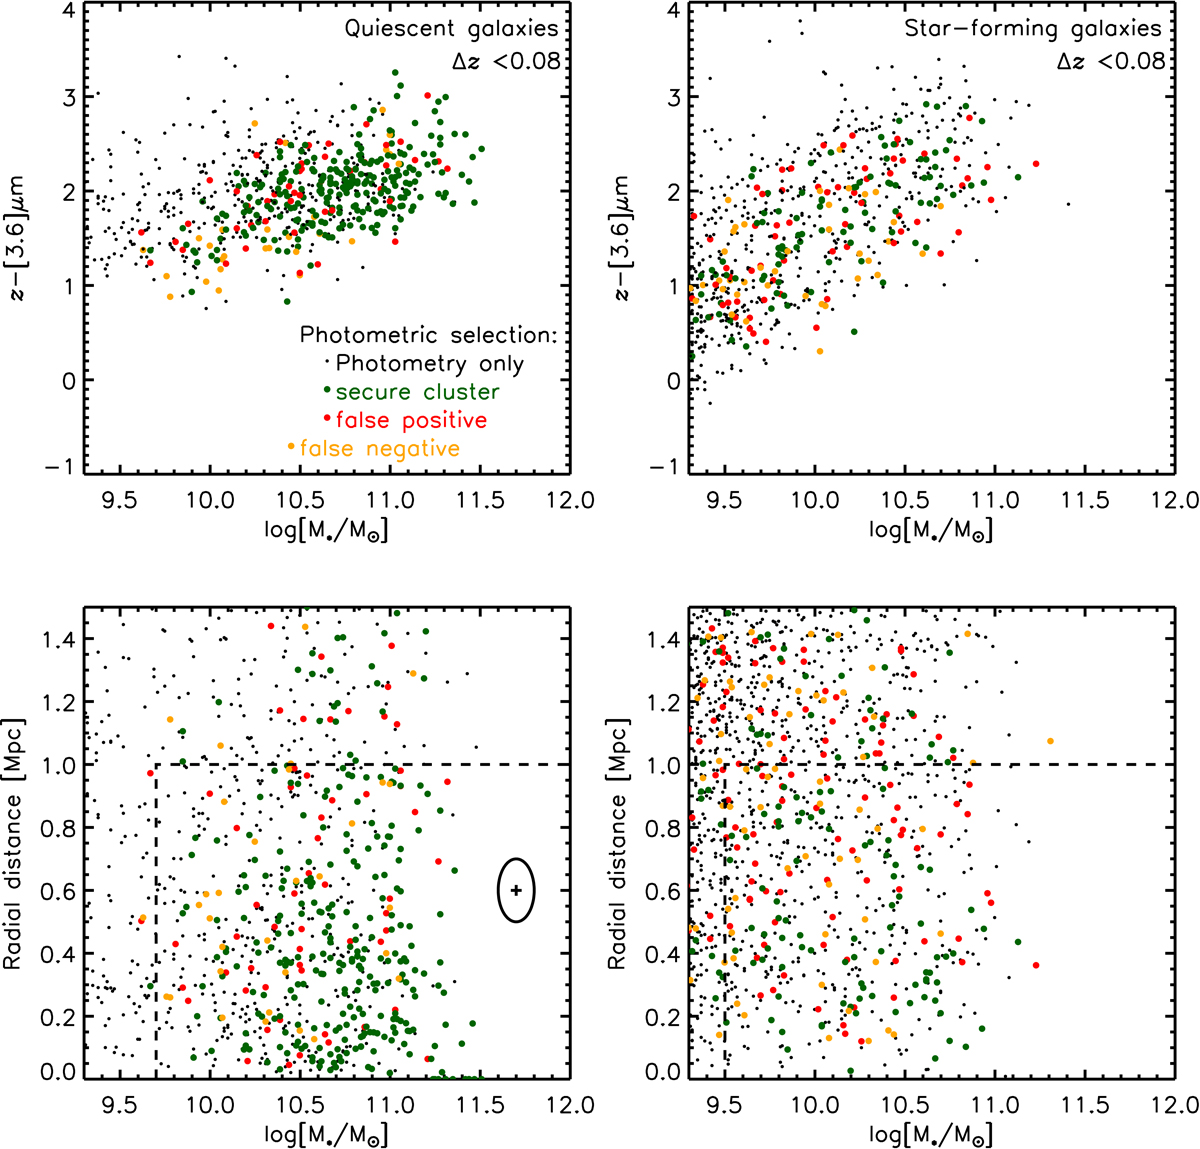
Top panels: colour–stellar mass diagram that compares the spectroscopic targets (coloured points) with photometrically selected cluster galaxy candidates (black+green+red). Our method of subtracting fore- and background interlopers relies on the spectroscopic subset being a representative subset. Left panel: quiescent galaxies, for which this criterion is not fully met at low masses. Right panel: star-forming galaxies, for which this assumption is valid. Lower panels: spectroscopic targets shown as a function of cluster-centric distance and stellar mass. The ellipse shows the relative weight we give to either parameter when defining the five closest sources in this plane (which are used to estimate membership for the black points). Dashed region defines the population studied in this work.
Current usage metrics show cumulative count of Article Views (full-text article views including HTML views, PDF and ePub downloads, according to the available data) and Abstracts Views on Vision4Press platform.
Data correspond to usage on the plateform after 2015. The current usage metrics is available 48-96 hours after online publication and is updated daily on week days.
Initial download of the metrics may take a while.