Fig. A.1.
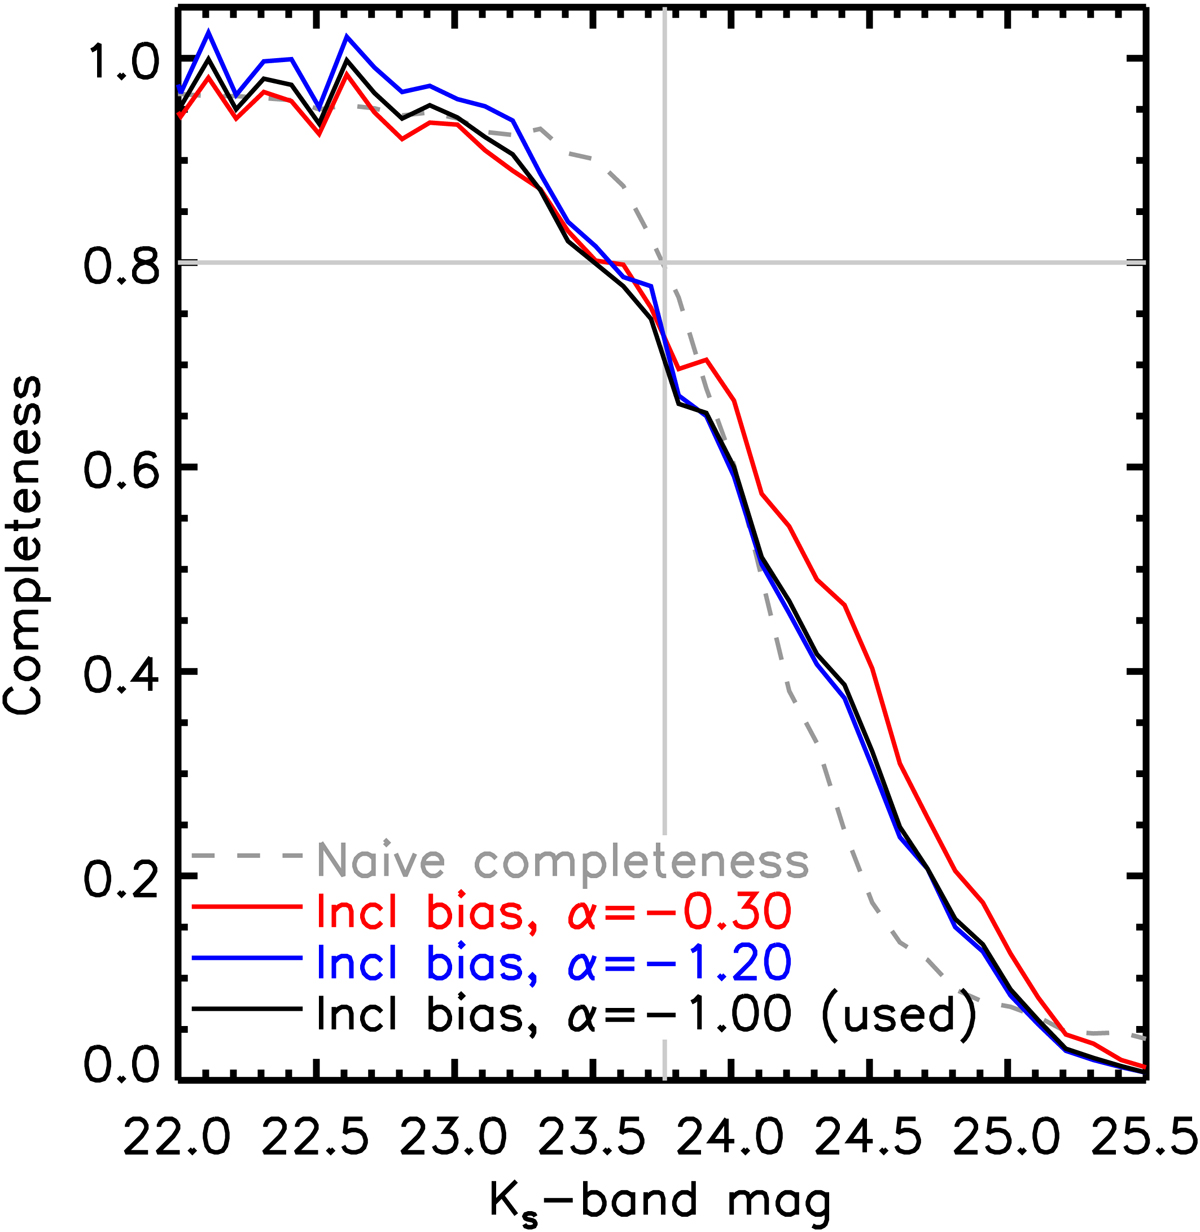
Completeness of the detected sources as a function of magnitude. This is for a cluster at median Ks-band depth. Grey dashed: naive correction factor in the absence of magnitude bias and Eddington bias. Here the x-axis refers to intrinsic magnitudes, and the y-axis to the fraction of these sources that is recovered (at any measured magnitude). Solid lines: completeness as a function of recovered magnitude for different intrinsic magnitude distributions (indicated by different colours). Here 1/Completeness would be the factor by which one needs to multiply the measured counts at different magnitudes, to recover the true intrinsic magnitude distribution. This corrects implicitly for magnitude- and Eddington bias. While we use the black solid curve in this work, we note that they are very similar in the range where the galaxy population is studied (i.e. leftward of the vertical grey line).
Current usage metrics show cumulative count of Article Views (full-text article views including HTML views, PDF and ePub downloads, according to the available data) and Abstracts Views on Vision4Press platform.
Data correspond to usage on the plateform after 2015. The current usage metrics is available 48-96 hours after online publication and is updated daily on week days.
Initial download of the metrics may take a while.