Open Access
Fig. 3.
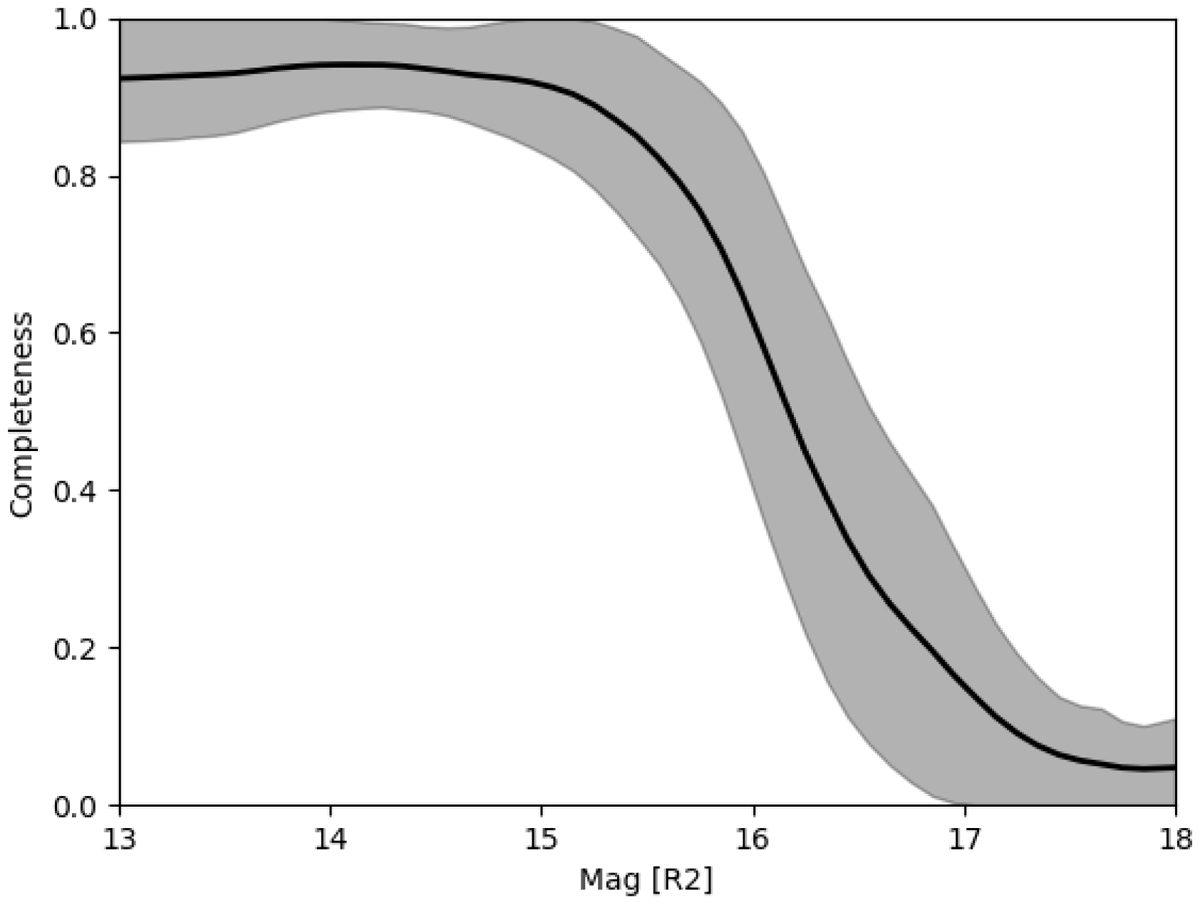
Completeness as a function of R2 magnitude for each magnitude bin. The solid line corresponds to the mean, and the shaded region shows the standard deviation of the completeness across the studied catalogue area.
Current usage metrics show cumulative count of Article Views (full-text article views including HTML views, PDF and ePub downloads, according to the available data) and Abstracts Views on Vision4Press platform.
Data correspond to usage on the plateform after 2015. The current usage metrics is available 48-96 hours after online publication and is updated daily on week days.
Initial download of the metrics may take a while.