Fig. 1.
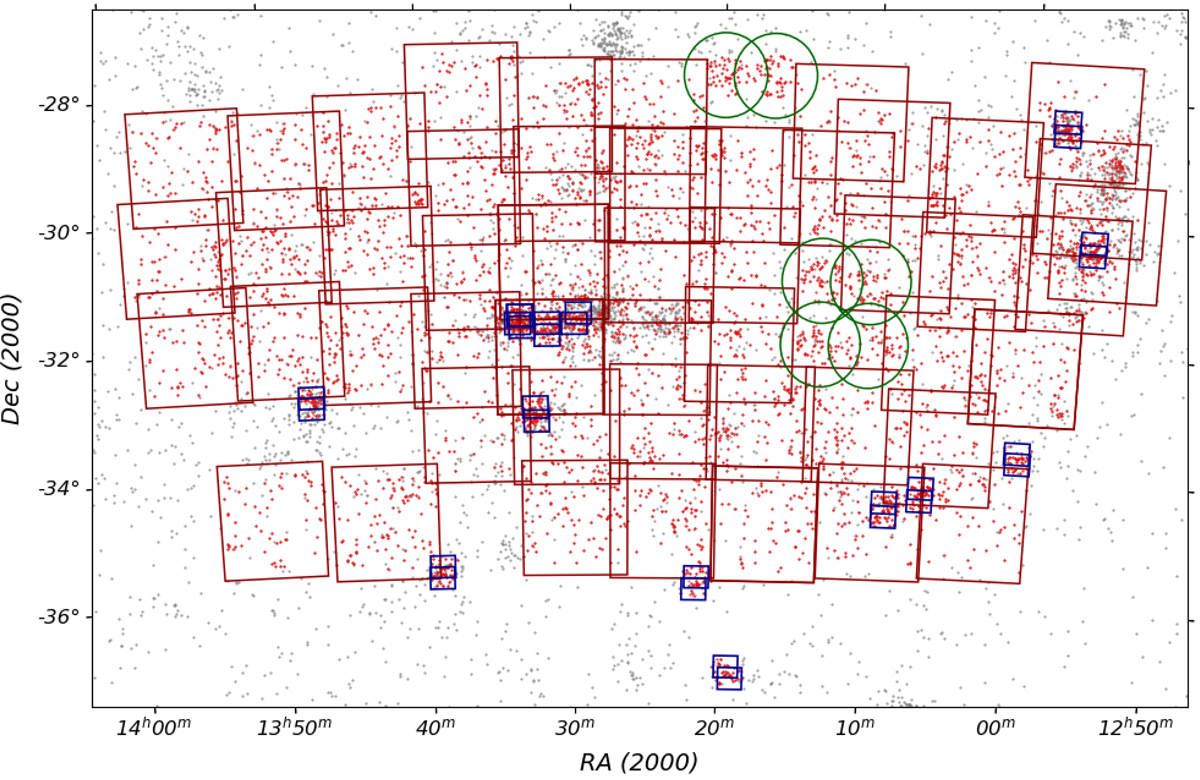
Spectroscopic survey fields reported in this paper. Large squares are LCO fiber spectrograph observations. Circles are Hydra fields observed at CTIO, and small blue squares are WFCCD fields observed at LCO. The area of this plot is smaller than the total catalogue area, chosen to zoom in on the surveyed fields. The gray dots represent the positions of all galaxies in the velocity catalogue. Red dots are the positions of those galaxies whose velocities were measured by our group and reported in this paper.
Current usage metrics show cumulative count of Article Views (full-text article views including HTML views, PDF and ePub downloads, according to the available data) and Abstracts Views on Vision4Press platform.
Data correspond to usage on the plateform after 2015. The current usage metrics is available 48-96 hours after online publication and is updated daily on week days.
Initial download of the metrics may take a while.