Fig. B.1
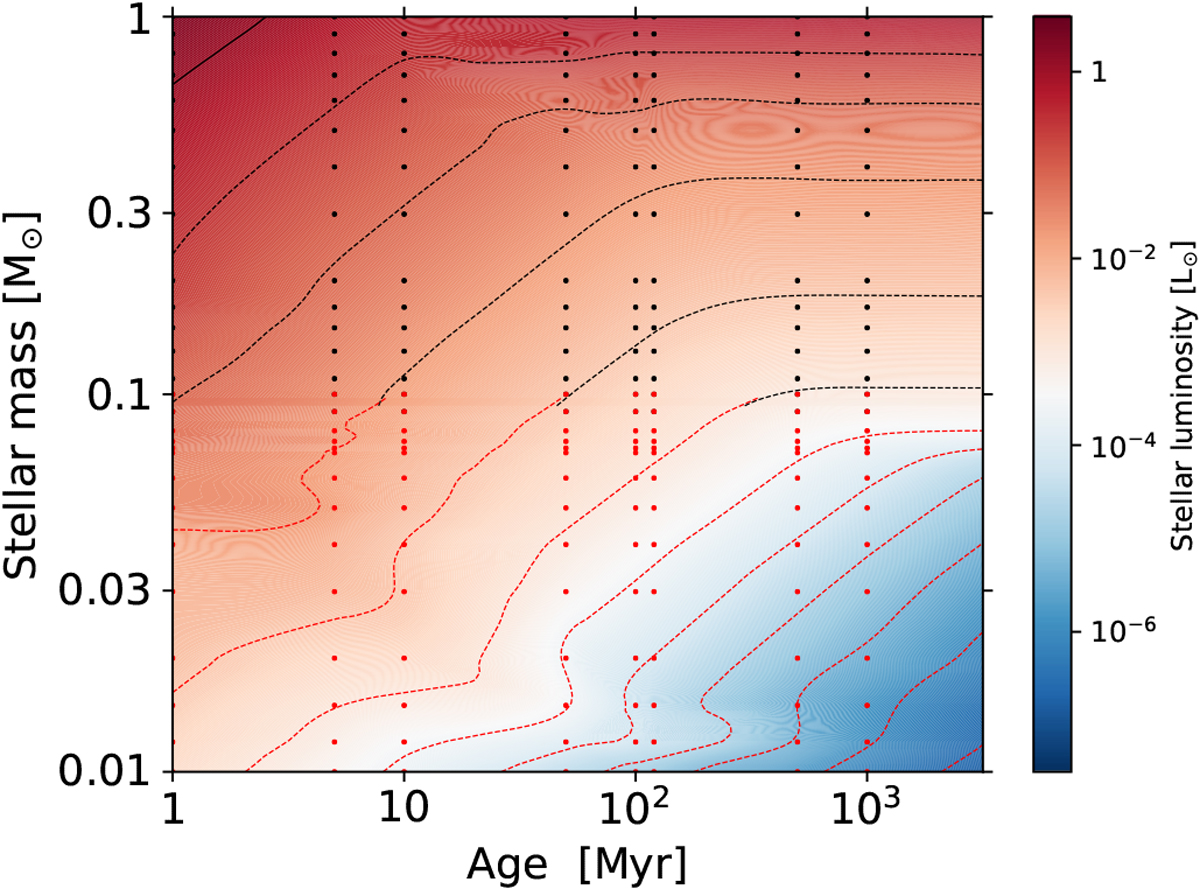
Stellar luminosity as function of time and stellar mass based on the stellar evolutionary model of Baraffe et al. (2003, 2015). The dots are data from the stellar evolution model, and the dashed line corresponds to the same luminosity. The black and red represent the stars above or below the hydrogen-burning limit. When the star is younger than
~ 10 Myr, ![]() , while
, while ![]() when stars are older.
when stars are older.
Current usage metrics show cumulative count of Article Views (full-text article views including HTML views, PDF and ePub downloads, according to the available data) and Abstracts Views on Vision4Press platform.
Data correspond to usage on the plateform after 2015. The current usage metrics is available 48-96 hours after online publication and is updated daily on week days.
Initial download of the metrics may take a while.