Fig. 8
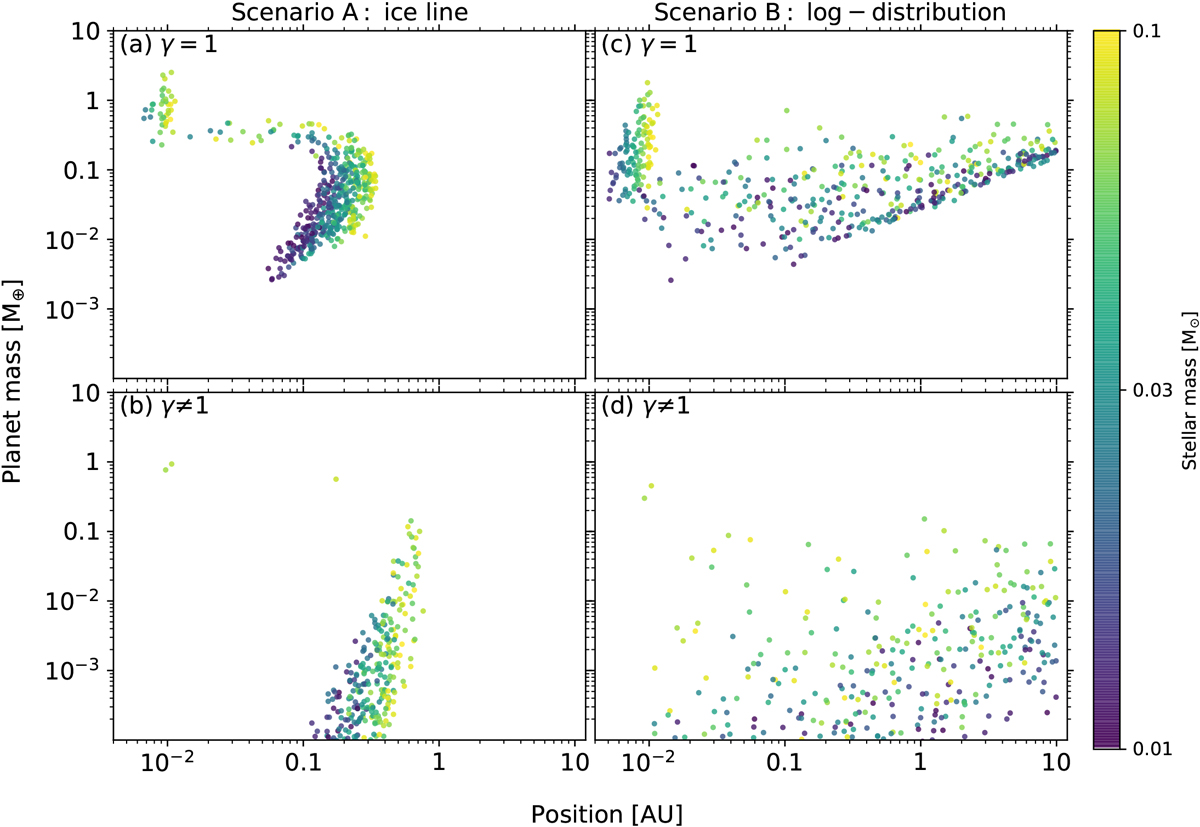
Monte Carlo sampling plot of the final planet mass vs. the semi-major axis, with the ice line planet formation model (Scenario A) on the left, the log-uniform distributed planet formation model (Scenario B) on the right, the self-gravitating disks (γ = 1) at the top and the non-self-gravitating disks (γ ≠ 1) at the bottom. The color corresponds to the (sub)stellar mass. Scenario A only produces close-in planets, while planets formed in Scenario B have a wide range of orbital distances. Growth and migration are more significant for the protoplanets around low-mass M-dwarfs than for those around brown dwarfs.
Current usage metrics show cumulative count of Article Views (full-text article views including HTML views, PDF and ePub downloads, according to the available data) and Abstracts Views on Vision4Press platform.
Data correspond to usage on the plateform after 2015. The current usage metrics is available 48-96 hours after online publication and is updated daily on week days.
Initial download of the metrics may take a while.