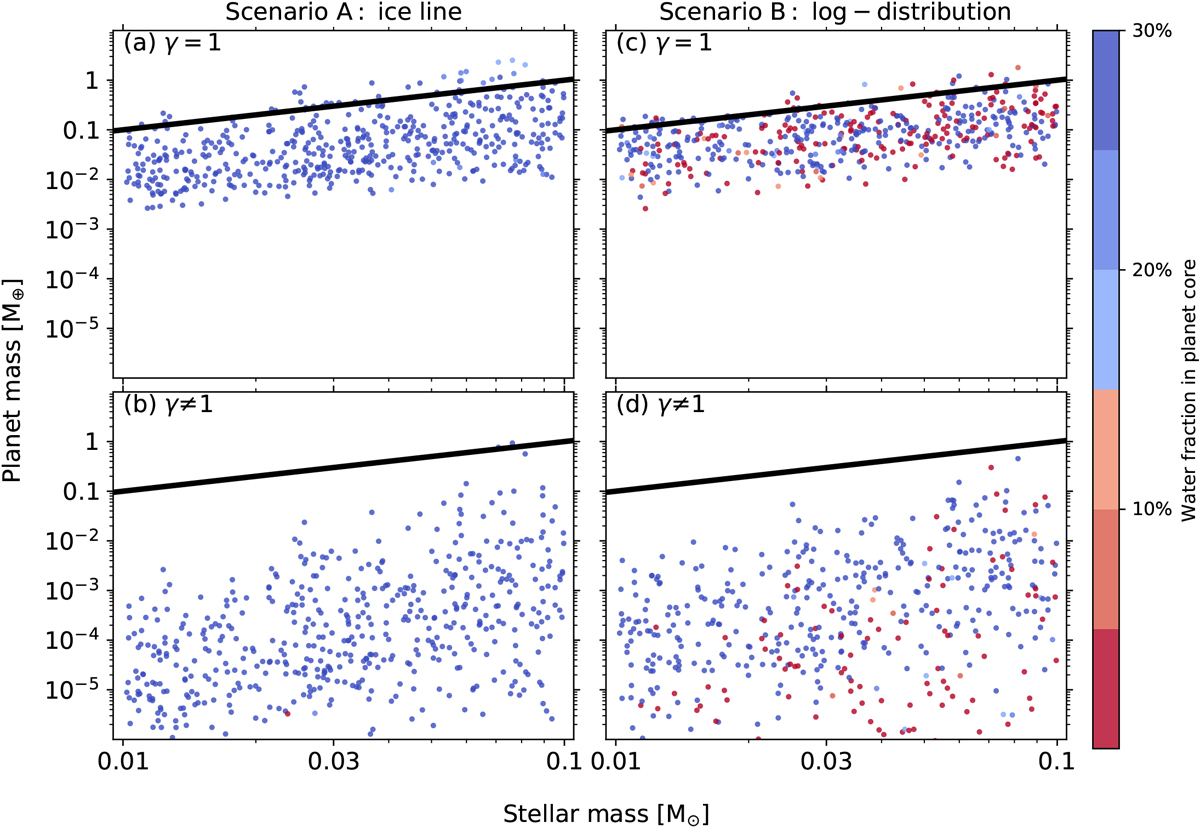
Fig. 7

Monte Carlo sampling plot of the planet mass as a function of the stellar mass, with the ice-line planet formation model (Scenario A) on the left, the log-uniform distributed planet formation model (Scenario B) on the right, the self-gravitating disks (γ = 1) at the top and the non-self-gravitating disks (γ ≠ 1) at the bottom. The color corresponds to the water mass fraction in the planetary core. The black line stands for a constant planet-to-star mass ratio of 3 × 10⁻⁵ motivated by Pascucci et al. (2018), which also approximates to the pebble isolation mass scaling (Lambrechts et al. 2014; Liu et al. 2019a). There is still an obvious Mp − M⋆ correlation for the central hosts in the ultra-cool dwarf mass regime of 0.01 M⊙ and 0.1 M⊙. This correlation is independent of the birth locations of protoplanets but relies on the disk conditions. Protoplanets can grow to the mass of Mars around 10MJup brown dwarfs when they are born in the self-gravitating disk phase, while they only reach 10−3 − 10−2 M⊕ when the protoplanets form later in the non-self-gravitating disk phase. Planets with ≳ 15% water can form at the water-ice line, while protoplanets formed over a wide range of disk distances end up with a distinctive bimodal water mass.
Current usage metrics show cumulative count of Article Views (full-text article views including HTML views, PDF and ePub downloads, according to the available data) and Abstracts Views on Vision4Press platform.
Data correspond to usage on the plateform after 2015. The current usage metrics is available 48-96 hours after online publication and is updated daily on week days.
Initial download of the metrics may take a while.


