Fig. 4
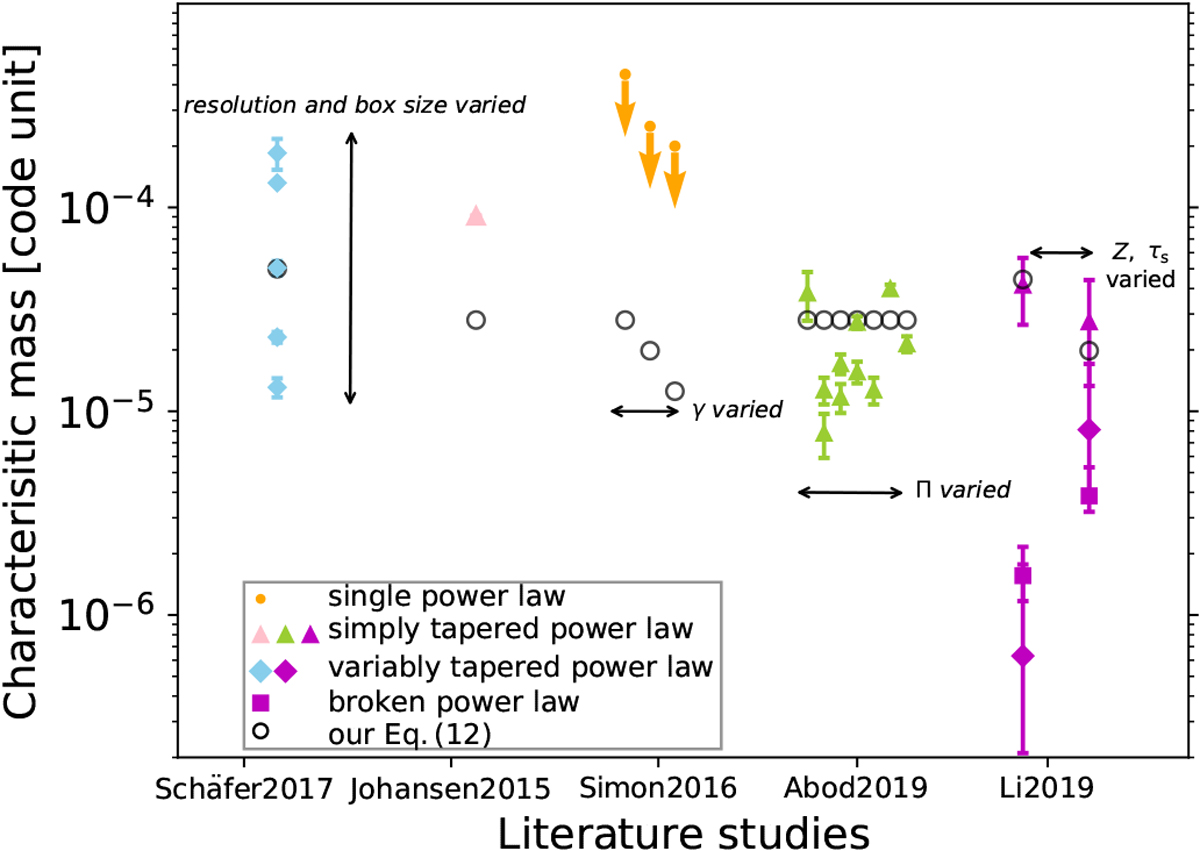
Characteristic mass comparison among literature studies and our Eq. (12) calibrated from the results of Schäfer et al. (2017). The planetesimals obtained from streaming instability simulations are fitted by different distributions, including a single power law (dot), a simply tapered power law (triangle), a variably tapered power law (diamond), and a broken power law (square). The details of these fitting formulas are explained in the main text. The pink, orange, blue, green, and magenta refer to the studies of Johansen et al. (2015), Simon et al. (2016), Schäfer et al. (2017), Abod et al. (2019), and Li et al. (2019), respectively. We note that the orange dots only refer to the maximum masses of the planetesimals; we add the downside arrows to indicate that the characteristic masses should be lower than these values. The characteristic masses obtained in each set ofparameters are shown in symbols with the same x-axis (see Table 1). We note that Z, γ, Π, and τs are different by orders of magnitude among these numerical studies. Our Eq. (12) agrees reasonably well with the fitting characteristic masses found in these studies.
Current usage metrics show cumulative count of Article Views (full-text article views including HTML views, PDF and ePub downloads, according to the available data) and Abstracts Views on Vision4Press platform.
Data correspond to usage on the plateform after 2015. The current usage metrics is available 48-96 hours after online publication and is updated daily on week days.
Initial download of the metrics may take a while.