Fig. 3
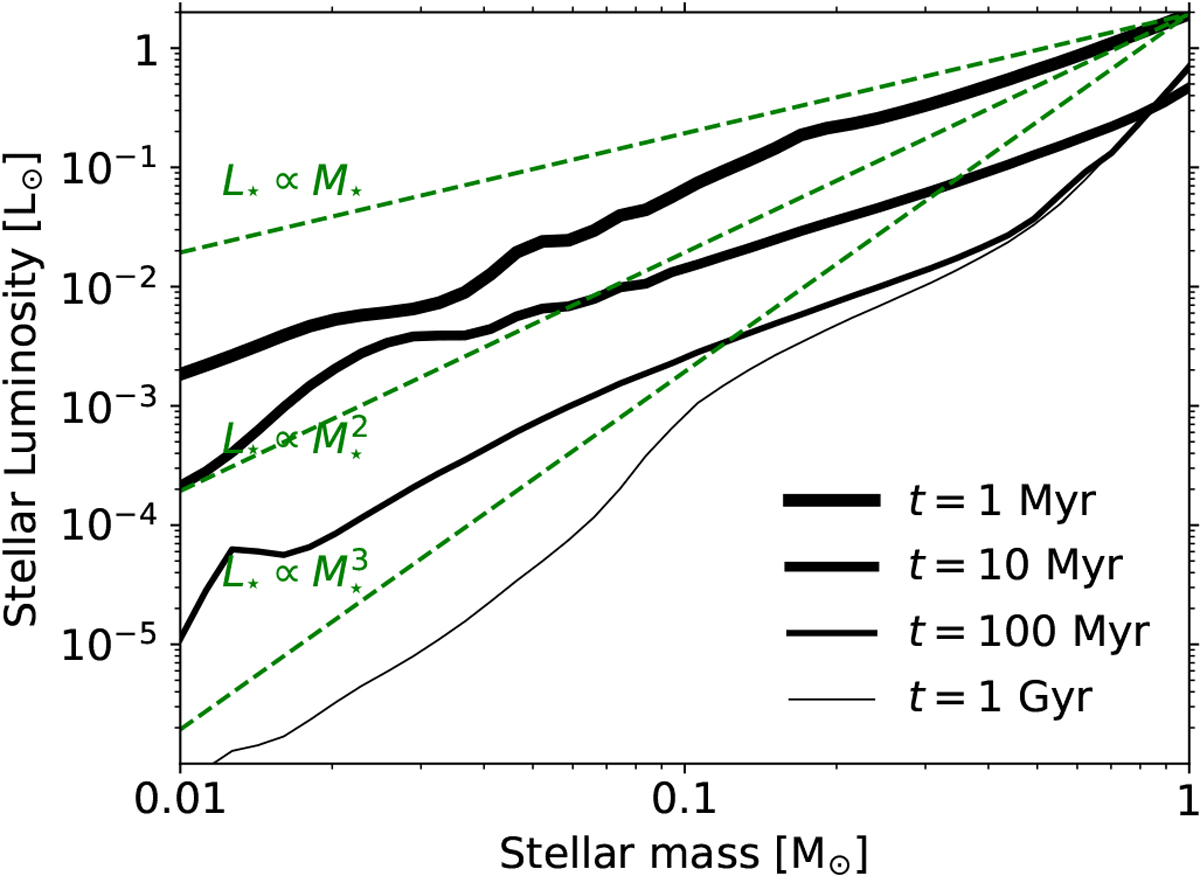
Time and (sub)stellar mass dependencies on the luminosity of the host based on the evolutionary model of Baraffe et al. (2003, 2015). The solid lines from thick to thin indicate the systems’ ages from 1 Myr to 10 Myr, 100 Myr, and 1 Gyr. Thegreen dashed lines correspond to a linear, quadratic, cubic, and fourth power correlation between the luminosity and mass. We find that when the central host is younger than 10 Myr, ![]() , while
, while ![]() when hosts are generally older than 10 Myr.
when hosts are generally older than 10 Myr.
Current usage metrics show cumulative count of Article Views (full-text article views including HTML views, PDF and ePub downloads, according to the available data) and Abstracts Views on Vision4Press platform.
Data correspond to usage on the plateform after 2015. The current usage metrics is available 48-96 hours after online publication and is updated daily on week days.
Initial download of the metrics may take a while.