Fig. C.4
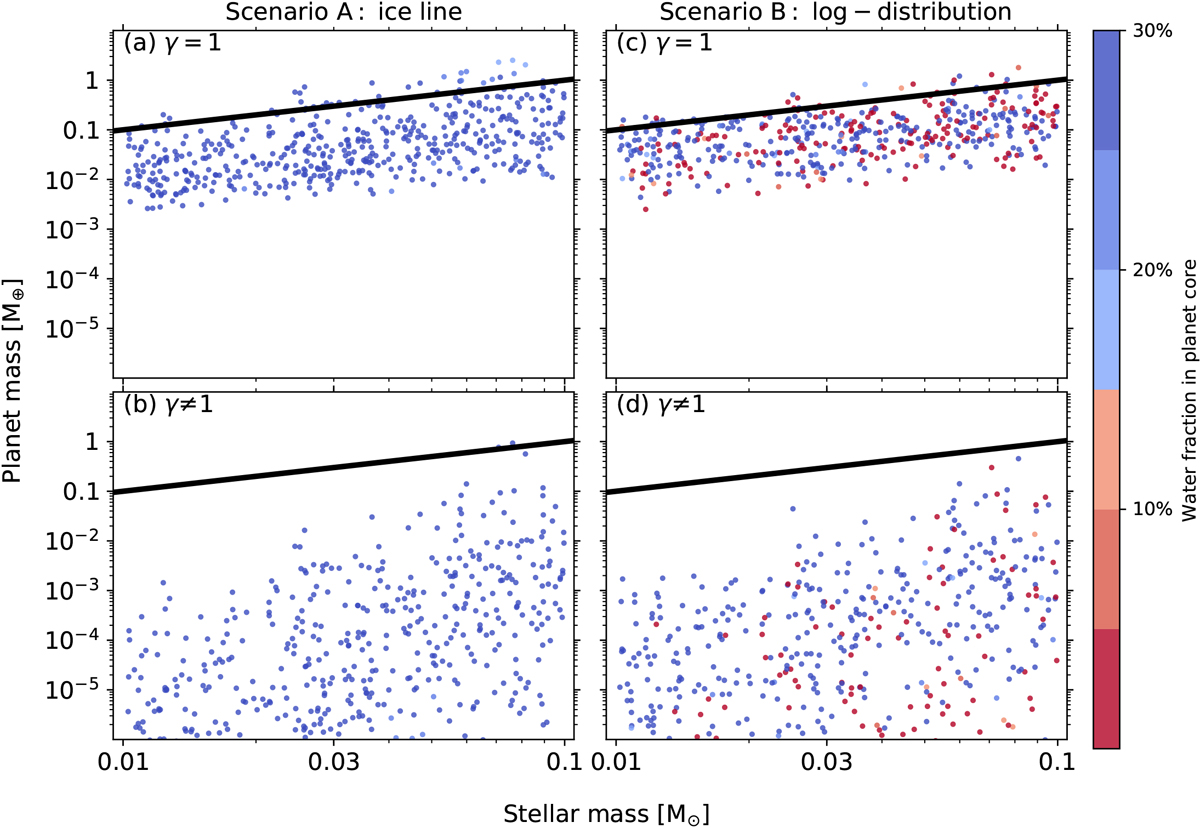
Monte Carlo sampling plot of planet mass vs. stellar mass, with the ice line planet formation model (Scenario A) on the left, the log-uniform distributed planet formation model (Scenario B) on the right, the self-gravitating disks (γ = 1) at the top and the non-self-gravitating disks (γ ≠ 1) at the bottom. The color corresponds to the water mass fraction in the planetary core. The black line represents a constant planet-to-star mass ratio of 3 × 10⁻⁵ motivated by Pascucci et al. (2018). Here we set the particle sizes by combined effects of radial drift, bouncing, and fragmentation. The resulting planet population is very similar to that of the fixed-sized particles model in Fig. 7.
Current usage metrics show cumulative count of Article Views (full-text article views including HTML views, PDF and ePub downloads, according to the available data) and Abstracts Views on Vision4Press platform.
Data correspond to usage on the plateform after 2015. The current usage metrics is available 48-96 hours after online publication and is updated daily on week days.
Initial download of the metrics may take a while.