Fig. 1
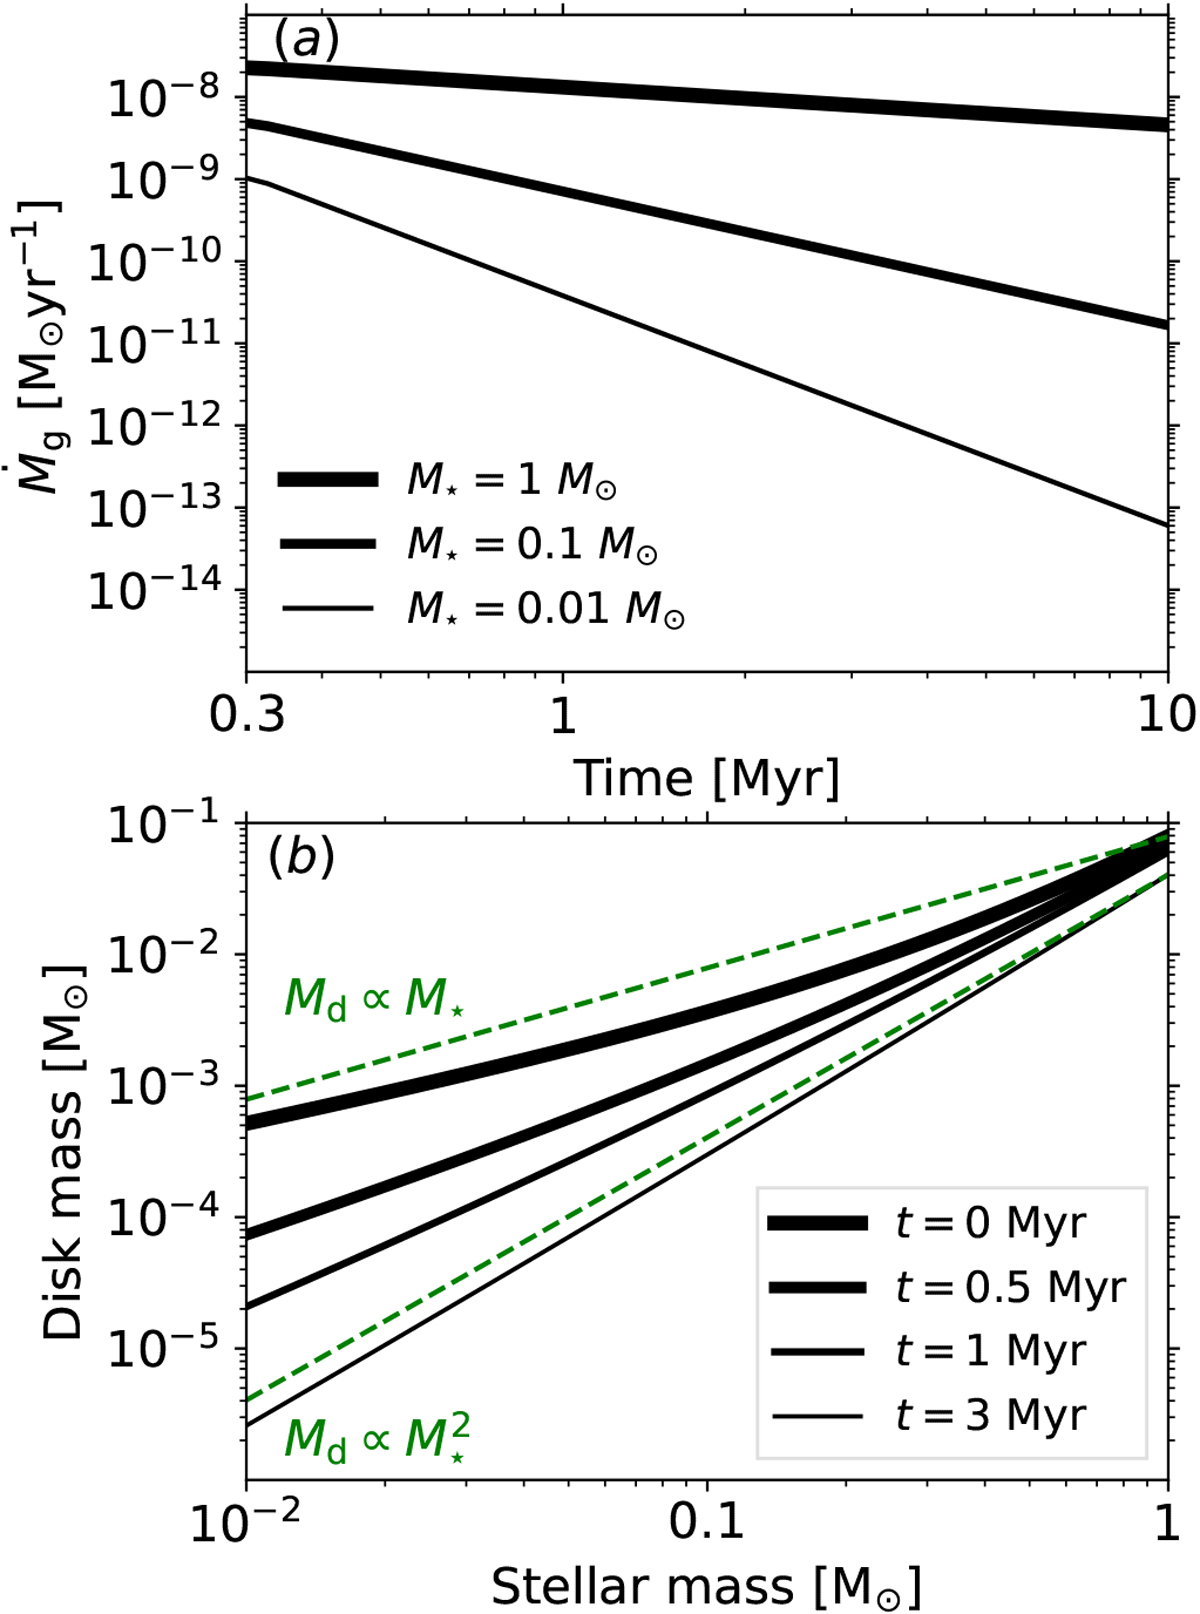
(a) Time evolution of disk accretion rates among three stars of different masses, based on Eq. (6) of Manara et al. (2012). The disk accretion rate drops faster with decreasing mass of the central object. (b) Disk mass vs. (sub)stellar mass at different times, based on Ṁg measurements of Manara et al. (2012). The solid lines from thick to thin represent the ages of systems, from 0 to 0.5, 1, and 3 Myr. The green dashed lines correspond to the linear and quadratic relation between the disk mass and the stellar mass. When the disk is ≲1 Myr old, Md ∝ M⋆, while ![]() when the age is greater than ~ 1−3 Myr.
when the age is greater than ~ 1−3 Myr.
Current usage metrics show cumulative count of Article Views (full-text article views including HTML views, PDF and ePub downloads, according to the available data) and Abstracts Views on Vision4Press platform.
Data correspond to usage on the plateform after 2015. The current usage metrics is available 48-96 hours after online publication and is updated daily on week days.
Initial download of the metrics may take a while.