Fig. A.1
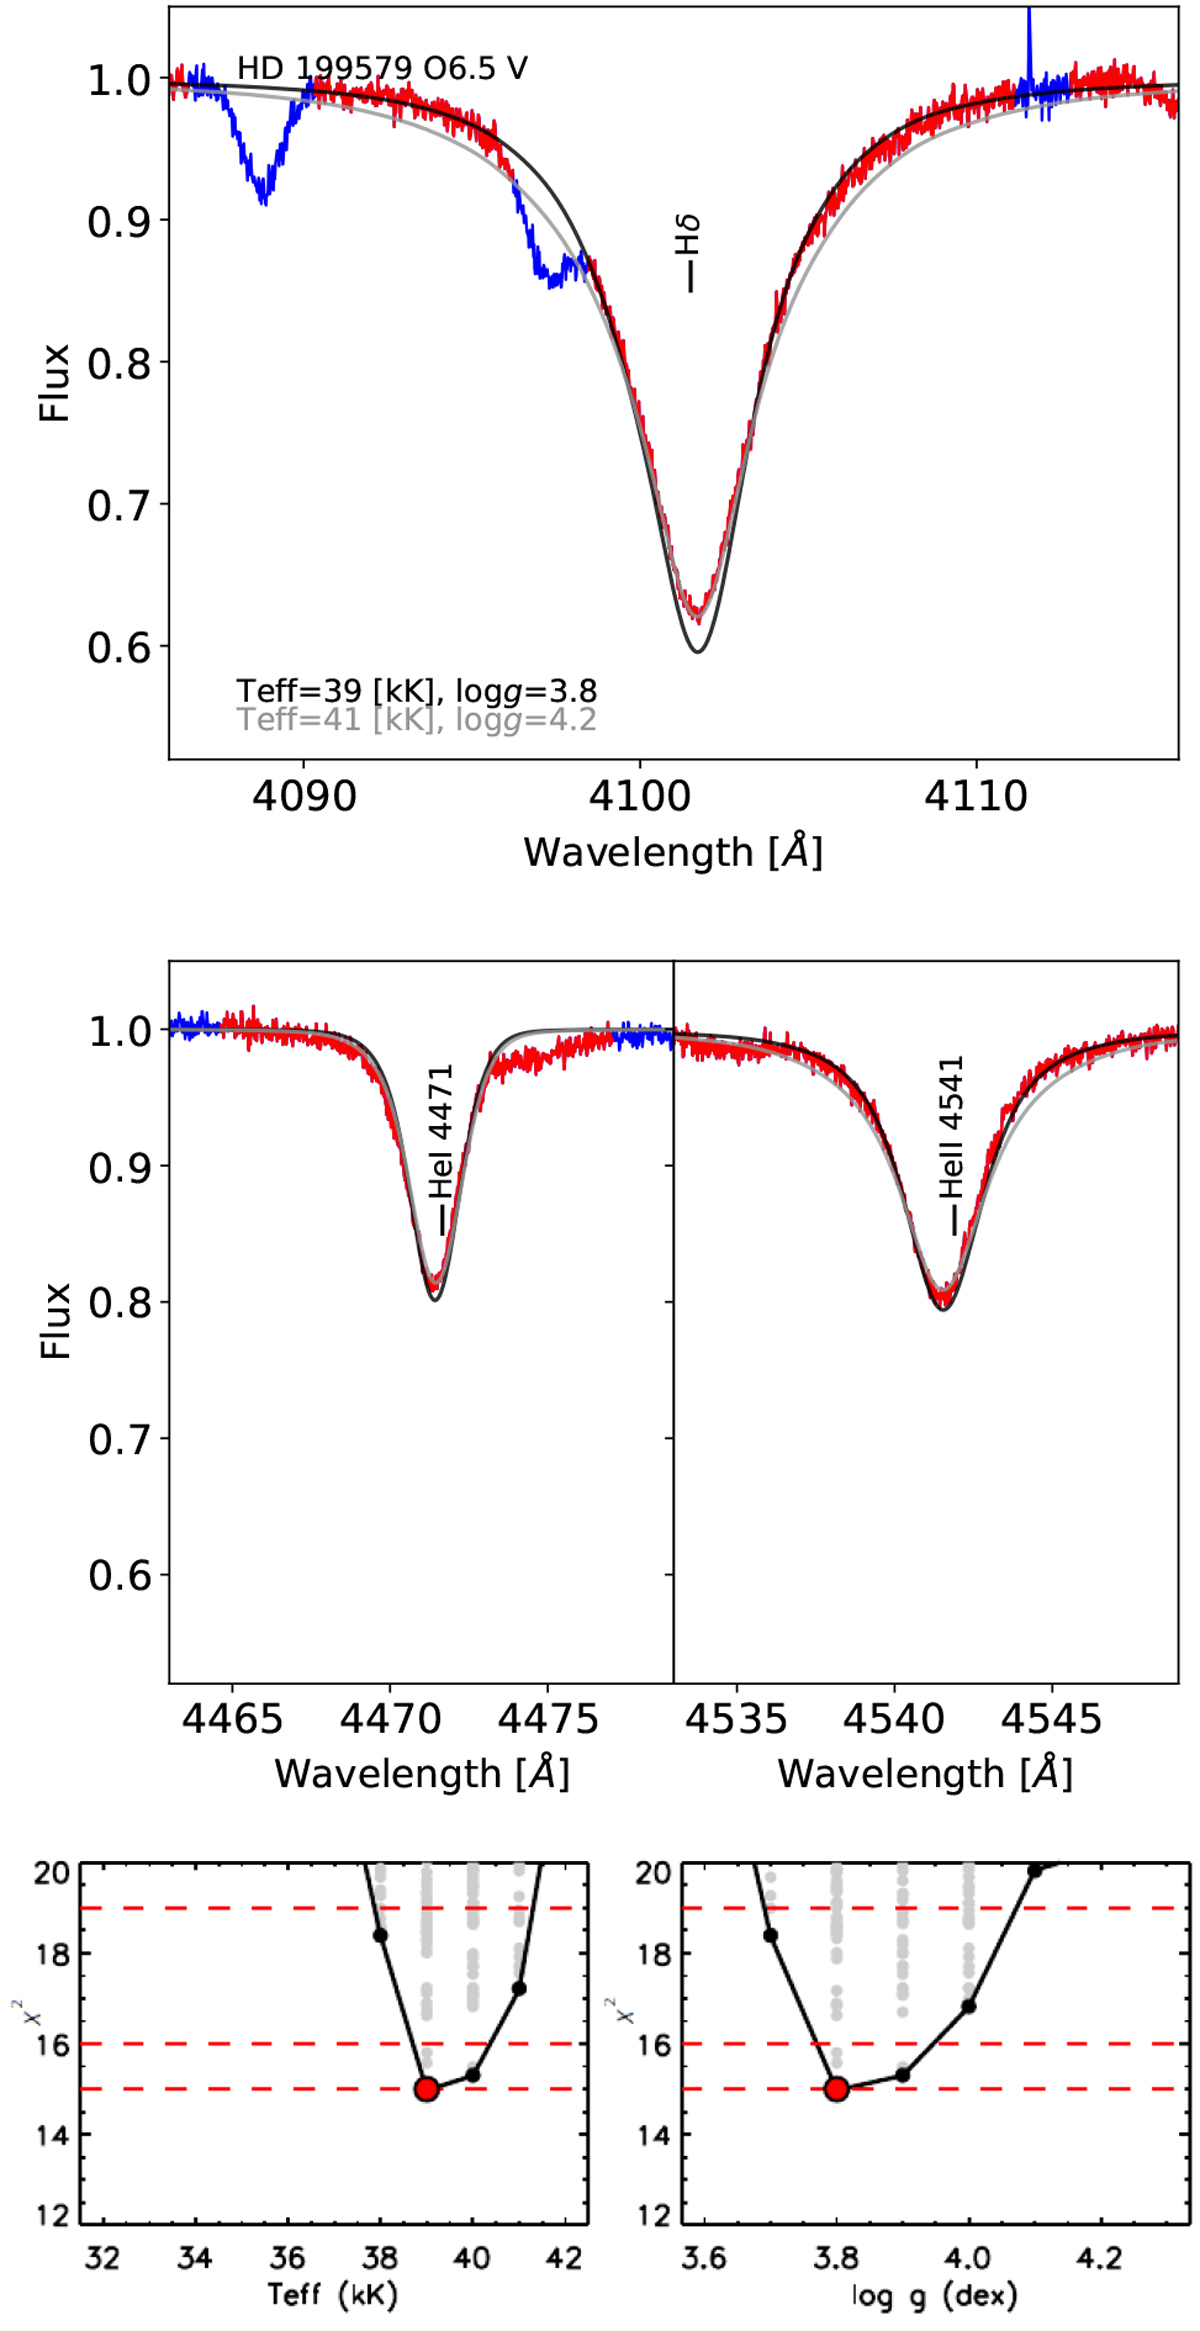
Top and middle: comparison of the synthetic spectra of two best-fitting FASTWIND models to the observed spectrum of the O6.5 Vz star HD 199579 for three diagnostic lines. The first best-fitting model corresponds to the IACOB-GBAT analysis with Teff and log g as free parameters (the red part is fitted and the blue part is ignored). In the second model, log g was fixed to 4.2 dex. Bottom: χ2 distributionsfor Teff and log g resulting from the IACOB-GBAT analysis. The horizontal dashed lines represent the value of χ2 for the best-fitting model (red dots) and the 1σ and 2σ confidence levels. Any model with log g ~ 4.2 is clearly beyond the 2σ level.
Current usage metrics show cumulative count of Article Views (full-text article views including HTML views, PDF and ePub downloads, according to the available data) and Abstracts Views on Vision4Press platform.
Data correspond to usage on the plateform after 2015. The current usage metrics is available 48-96 hours after online publication and is updated daily on week days.
Initial download of the metrics may take a while.